ThomasPartners Strategies
For the income you need now and in the future.

Why ThomasPartners Strategies
Why ThomasPartners Strategies
Soft music plays throughout.
A man in outdoor attire and glasses, Greg Thomas, hikes across a bridge in a wooded area with a Labrador retriever.
Greg Thomas [off-screen]: I retired the first time in 1992. At the time I retired, I was faced with that issue that so many retirees face—how do you live off your money? I will tell you honestly, in the first year I'd wake up in the middle of the night and I'd go to my office, and I'd pull out my financial statements and I'd calculate it all again.
Greg continues hiking with his dog across a wooden bridge and rocks in a stream into clusters of thin trees.
Greg [off-screen]: Just in case—had I fooled myself, had I convinced myself? It's very scary.
Greg sits in a patterned armchair in a sitting room with flames flickering in the fireplace.
Greg [onscreen]: And I think most everybody has that feeling.
The woods reappear. Greg, wearing a hat, looks out at the woods and the open landscape. The dog runs up a hill with something in its mouth, and the two hike together down a worn trail along the hillside.
Greg [off-screen]: You realize how vulnerable you are. And I started to realize that, in retirement, having that income stream to replace the employment check that you might once have had was just crucial to my own well-being, and really my mental well-being.
The clean windows of an urban office building reflect sailboats on a bay. A wall appears with the ThomasPartners logo.
Greg [off-screen]: I founded ThomasPartners in the late summer of 2001. A lot of my friends were in their mid-50s.
Greg sits in the armchair in the sitting room.
Greg [onscreen]: Many of them had suffered pretty badly in the 2000 crash when all the dot-coms fell, and they were looking for something that met the needs of their retirement far more than taking wild risks on new industries and new kinds of companies.
Several businesspeople are having a discussion around a table in a conference room. A businessman sits in front of several computer monitors, comprehending the data on the screens. The boats move in and out of the bay next to an urban area. Greg sits at a desk with two laptops and a cup of coffee, immersed in his work.
Greg [off-screen]: During that time my strategy of dividend investing started to look pretty good. The vision was that we would do one thing, which was build dividend growth portfolios. And that was all we would do. We had three objectives: income every month, income growth every year, capital gains over time—in that order.
A man in business attire speaks on the phone in front of four combined computer monitors displaying analytics and data. A different man in business attire stands in front of his own four-monitor display, smiling while on the phone. Two businessmen speak animatedly in front of a big window overlooking the bay.
Greg [off-screen]: The best place to be in retirement is where you don't have to worry about how you're going to pay for it or how you can afford it. We feel that we really facilitate that by taking away, for many of them, the burden of worrying about how their money is investing and where their funds are coming from.
An older man rides a bicycle down a street. A different older man smiles as he chops herbs and slides sliced vegetables onto a skewer. He sprinkles the herbs around a fish fillet, topped with lemon slices.
Greg [off-screen]: For me, the real satisfaction comes from the individuals who articulate to us how we've helped them accomplish a more stable, more secure, and happier retirement.
A little girl runs up a few stair steps, where an older woman smiles and lifts her off the ground. The two sit down with a cello, and the older woman is showing the little girl how to play. The older woman stands proudly with her cello.
Greg [off-screen]: It's never been a business to me. It's been a passion. I enjoy the process of investing, I enjoy people, I like to solve problems. And the fact that it was a successful business was really kind of a byproduct of doing what I like to do and doing it for others.
Greg sits at his desk with his two laptops. Boats travel across the bay. Multiple businesspeople discuss with each other or study their computer monitors, and a view of a clocktower between two other urban buildings appears.
Greg [off-screen]: But as I think about—the greatest satisfaction is what we've done for a large number of clients who arrived at our doorstep unsure of how to approach retirement investing, and who today are very satisfied that they have the right strategy, they're in the right place, and they are enjoying their retirement more, as a consequence.
Greg and his dog continue hiking a hillside with sparse trees. Some of the hills have a bit of snow, and the sky has clouds stretched thin. Greg stops at the top of a hill and looks out over the scenery with a look of pride and joy.
The ThomasPartners® logo appears.
Onscreen text:
Past performance is no guarantee of future results; the value of investments and the income derived from them can go down as well as up. Future returns and the achievement of stated goals are not guaranteed, and a loss of principal may occur.
Please refer to the Charles Schwab Investment Management, Inc. Disclosure Brochure for additional information.
Diversification strategies do not ensure a profit and do not protect against losses in declining markets.
Investments in managed accounts should be considered in view of a larger, more diversified investment portfolio.
There are risks associated with any investment approach, and the ThomasPartners Strategies have their own set of risks: First, there are the risks associated with investing in dividend-paying stocks, including but not limited to the risk that stocks in the Strategies may reduce or stop paying dividends, affecting the Strategy's ability to generate income. Second, investor sentiment could cause dividend-paying equities to fall out of favor and decrease in price. Third, there are risks associated with investing in fixed income asset classes, including through the use of exchange traded funds (ETFs), that include but are not limited to: interest rate risk, credit risk, high yield risk, and government security risk. Fourth, there are risks associated with investing in international stocks, including but not limited to: differences in financial accounting standards, currency fluctuations, geopolitical risk, foreign taxes and regulations, and the potential for illiquid markets. Fifth there are risks with Master Limited Partnership (MLP) securities (units) that differ from an investment in common stock. Holders of the units of MLPs have more limited control and limited rights to vote on matters affecting the partnership. For example, unit holders may not elect the general partner or the directors of the general partner, and they have limited ability to remove a MLP's general partner. MLPs may issue additional common units without unit holder approval, which would dilute existing unit holders. In addition, conflicts of interest may exist between common unit holders, subordinated unit holders, and the general partner of a MLP, including a conflict arising as a result of incentive distribution payments. As an income producing investment, MLPs could be affected by increases in interest rates and inflation. There are also certain tax related risks associated with an investment in units of MLPs, including that MLPs may convert to a C-Corporation. This conversion could cause a cut in distributions as well as an adverse tax event for long-time owners of the MLP. Lastly there are risks associated with Real Estate Investment Trusts (REITs), including REITs will be subject to the risks associated with the direct ownership of real estate, including fluctuations in the value of underlying properties, defaults by borrowers or tenants, changes in interest rates and risks related to general or local economic conditions. REITs are also subject to certain additional risks, for example, REITs are dependent upon specialized management skills and cash flows, and may have their investments in relatively few properties, a small geographic area or a single property type. Failure of a company to qualify as a REIT under federal tax law may have adverse consequences on a client account.
In addition, REITs have their own expenses, and a client account will bear a proportionate share of those expenses. Please discuss these and other potential risks with your Financial Consultant or investment advisor prior to investing.
Portfolio Management for ThomasPartners Strategies is provided by Charles Schwab Investment Management, Inc., dba Schwab Asset Management®, a registered investment adviser and an affiliate of Charles Schwab & Co., Inc. ("Schwab"). Schwab Asset Management and Schwab are separate entities and subsidiaries of The Charles Schwab Corporation.
©2024 Charles Schwab Investment Management, Inc. All rights reserved.
CC11398105 (0924-P83F) (09/24)
Be ready for tomorrow with ThomasPartners Strategies.
Like most retirees, Greg Thomas, founder of the ThomasPartners® Strategies, started questioning his financial readiness. His quest to find answers led him to create ThomasPartners Strategies.
Today, over 19 years later, our focus remains the same: helping you achieve and maintain the retirement you want through income-oriented strategies that meet your needs today and in the future.
ThomasPartners Strategies are managed by Charles Schwab Investment Management, Inc.
Contact your Schwab Financial Consultant or connect with us to learn more.
Let's talk
Our philosophy
ThomasPartners believes that a meaningful and increasing portfolio dividend income stream can provide a predictable source of income with the potential for income growth, without sacrificing the portfolio's total return potential over time.
Having enough income is one thing. Having an income stream that lasts is another.
ThomasPartners Strategies offer different investment strategies that share three objectives
-
 Monthly Income
Seek to provide monthly income by investing in companies with predictable dividends and interest-paying fixed income investments.
-
 Income Growth
Strategically invest within and allocate across dividend-growth companies and fixed income investments in an effort to grow the portfolio’s income over time.
-
 Competitive Total Returns Over Time
Seek to deliver competitive total returns over time through income generation and price appreciation.
Choose a strategy that's right for you.
-
Dividend Growth Strategy

This may be the right strategy for you if you're looking for an equity-building solution designed to complement a broader portfolio.
-
Balanced Income Strategies
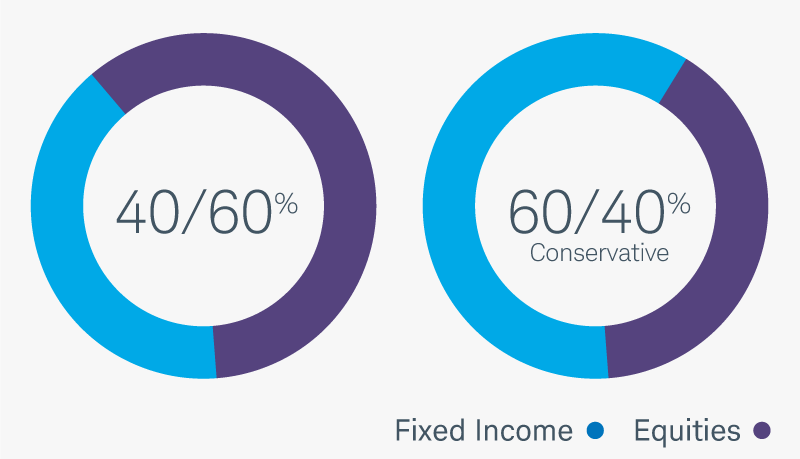
This may be the right strategy if you want a blend of equities and fixed income based on your risk tolerance.
Make solid investments decisions by reviewing important details.
-
Dividend Growth - Annual Program Fee1
- Balanced Income - Annual Program Fee1
-
Investment amount up to $500,000
Dividend Growth - Annual Program Fee1
0.90%Balanced Income - Annual Program Fee10.80%-
Next $500,000 (over $500,000 up to $1 million)Dividend Growth - Annual Program Fee1
0.80%Balanced Income - Annual Program Fee10.70%-
Next $1 million (over $1 million up to $2 million)Dividend Growth - Annual Program Fee1
0.70%Balanced Income - Annual Program Fee10.60%-
Over $2 millionDividend Growth - Annual Program Fee1
0.50%Balanced Income - Annual Program Fee10.40%Looking for help? Let's start a conversation.
Tell us about yourself so we can help connect you to the support you need. Just answer a few questions and we'll reach out by email or phone.
Satisfaction GuaranteeAt Schwab, we believe every investor deserves to work with a firm they can count on. Our commitment to your satisfaction is backed by a guarantee. If for any reason you're not happy with ThomasPartners Strategies, we'll refund your program fee from the previous quarter and work with you to make things right.*
*Refund requests must be received within 90 days of the date the fee was charged. Go to schwab.com/satisfaction to learn what's included and how it works.
Questions? We're ready to help.
-
 Call
Call -
 Chat
Chat -
 Visit
Visit