Welcome USAA members.
7 Investing Principles
The basic building blocks of investing.


1. Establish a plan based on your goals.
- Be realistic about your goals.
- Review your plan at least annually.
- Make changes as your life circumstances change.
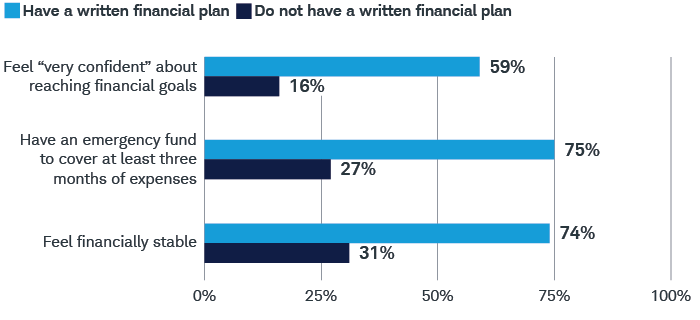
Planning can help propel investors toward their goals.
The more change we experience in our lives—or in the world—the more we need a plan. Investors who plan for their current and future financial, investment, wealth, or legacy needs, and who monitor those plans, are more likely to take the steps necessary to achieve their financial goals. Investors with a written financial plan have better saving and financial habits than those who don't.
-
Source: Schwab Modern Wealth Survey. The online survey was conducted March 4–18, 2024, in partnership with Logica Research among a national sample of Americans aged 21 to 75. Survey sample size was 1000.
Investing involves risk, including loss of principal.
This material is intended for general informational and educational purposes only. This should not be considered an individualized recommendation or personalized investment advice. The investment strategies mentioned are not suitable for everyone. Each investor needs to review an investment strategy for his or her own particular situation before making any investment decisions.
Data contained herein from third party providers is obtained from what are considered reliable sources. However, its accuracy, completeness or reliability cannot be guaranteed.
Supporting documentation for any claims or statistical information is available upon request.
See how every Schwab client can get a complimentary plan focused on retirement.
Learn more

2. Start saving and investing today.
- Get started—or if you're already investing, keep doing so.
- Remember, investing involves risk and losses are inevitable—but time in the market is key.
- Don't try to time the markets—it's nearly impossible.
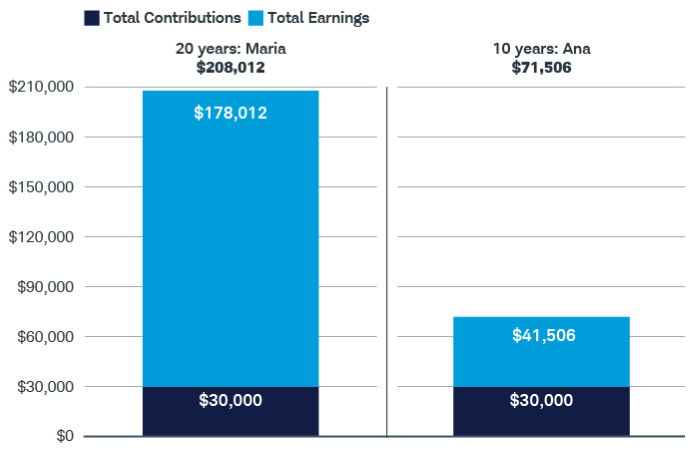
One basic principle is to invest early.
In this example, Maria and Ana each invested $3,000 every year on January 1 for 10 years—regardless of whether the market was up or down. But Maria started 20 years ago, whereas Ana started only 10 years ago. So, although they each invested a total of $30,000, by the end of 2025, Maria had about $135,000 more because she was in the market longer.
-
Source: Schwab Center for Financial Research with data from Morningstar. Invested in a hypothetical portfolio that tracks the S&P 500® index from January 1, 2006, to December 31, 2025, for Maria, and from January 1, 2016, to December 31, 2025, for Ana. The end amount includes capital appreciation and dividends. Dividends are assumed to be reinvested when received. Fees, expenses, and taxes would lower returns. Ana's average annual rate of return is 14.82%; Maria's is 11.00%. The actual rate of return will fluctuate with market conditions. Indexes are unmanaged, do not incur management fees, costs, and expenses, and cannot be invested in directly. This hypothetical example is only for illustrative purposes. Investing involves risk, including loss of principal. Past performance is no guarantee of future results.
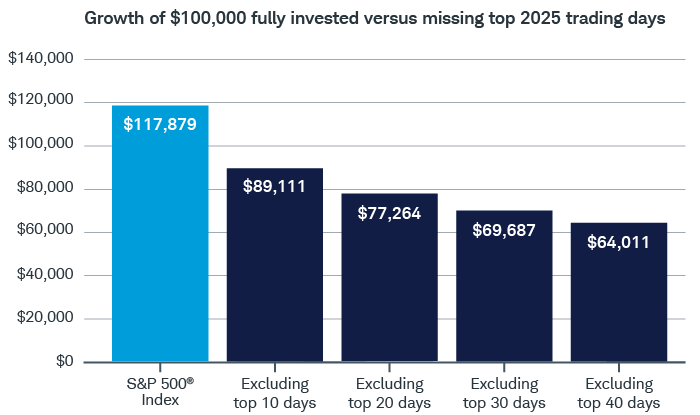
Don't try to predict market highs and lows.
The market is volatile by nature, and many investors are tempted to get out of the market when things turn bad. But that doesn't necessarily work out in your favor. For example, if you had invested $100,000 on January 1, 2025, but missed the top 10 trading days, you'd have had $28,768 less by the end of the year than if you'd stayed invested the whole time.
-
Source: Schwab Center for Financial Research with data from Morningstar. The year begins on the first trading day in January and ends on the last trading day of December, and daily total returns were used. Returns assume reinvestment of dividends. Fees, expenses, and taxes would lower returns. When out of the market, cash is not invested. Market returns are represented by the S&P 500 index, an index of widely traded stocks. Top days are defined as the best performing days of the S&P 500 during 2025. Indexes are unmanaged, do not incur management fees, costs, and expenses, and cannot be invested in directly. This hypothetical example is only for illustrative purposes. Investing involves risk, including loss of principal. Past performance is no guarantee of future results.
Take action on these principles with Schwab's investment advice solutions.
Learn more
3. Build a diversified portfolio based on your tolerance for risk.
- Know your time horizon and your ability, capacity, and willingness to take risk—including loss of principal.
- Understand that asset classes behave differently and play different roles in your portfolio.
- Don't chase past performance.
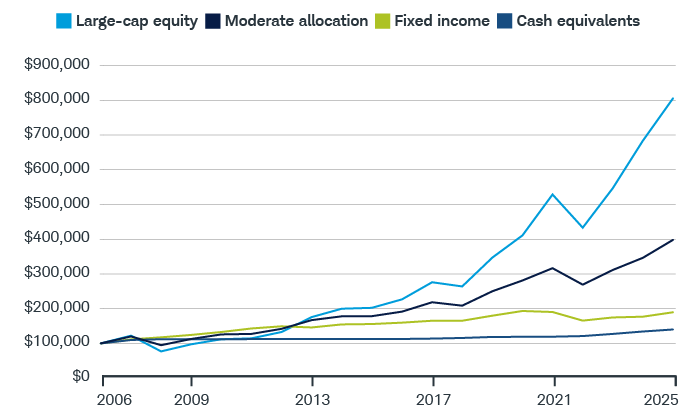
Asset classes have performed differently.
Asset classes, whether traditional (such as stocks, bonds, and cash) or nontraditional (such as cryptocurrencies and alternatives) have different levels of expected risk, return, and diversification power. Understand each asset class before investing in it.
$100,000 invested at the beginning of 2006 would have had a volatile journey to over $805,000 by the end of 2025 if invested in U.S. stocks. If invested in cash equivalent investments or bonds, the investor's ending amount would be lower, but their path would have been smoother. Investing in a moderate allocation portfolio would have combined some of the growth of stocks with lower volatility over the long term.
-
Source: Schwab Center for Financial Research with data from Morningstar. Time period examined is from January 1, 2006, to December 31, 2025. The indexes used are: S&P 500 (large-cap equity), Russell 2000® (small-cap equity), MSCI EAFE® Net of Taxes (international equity), Bloomberg U.S. Aggregate Bond Index (fixed income), and FTSE U.S. 3-Month Treasury Bill Index (cash equivalents). The Moderate Allocation is 35% large-cap equity, 10% small-cap equity, 15% international equity, 35% fixed income, and 5% cash, using the indexes noted. Indexes are unmanaged, do not incur management fees, costs, and expenses, and cannot be invested in directly. Fees, expenses, and personal income taxes would lower returns. This hypothetical example is only for illustrative purposes. Investing involves risk, including loss of principal. Past performance is no guarantee of future results.
It's nearly impossible to predict which asset classes will perform best in a given year.
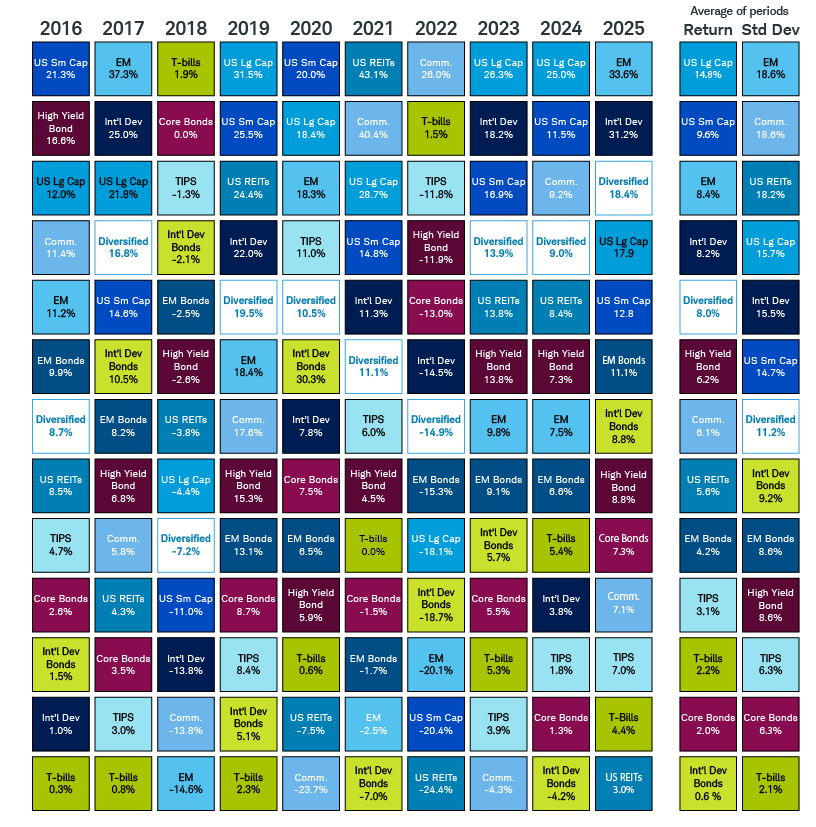
-
Source: Morningstar Direct and the Schwab Center for Financial Research. Data is from January 1, 2016, to December 31, 2025. Asset class performance represented by annual total returns for the following indexes: S&P 500® index (U.S. Large-Cap), Russell 2000® Index (U.S. Small-Cap), MSCI EAFE® Index Net of taxes (Int'l Dev), MSCI Emerging Markets Index (EM), S&P U.S. Real Estate Investment Trust Index (U.S. REITs), S&P GSCI® (Commodities), Bloomberg U.S. Treasury Inflation-Linked Bond Index (TIPS), Bloomberg US Aggregate Bond Index (Core Bonds), Bloomberg VLI High Yield Bond Index (High Yield Bonds), Bloomberg Global Aggregate Ex-USD Bond Index (Int'l Dev Bonds), Bloomberg Emerging Markets USD Aggregate Bond Index (EM Bonds), and FTSE U.S. 3-month Treasury Bill Index (T-Bills). Total returns include reinvestment of dividends, interest, and other cash flows. Standard deviation, commonly used as a measurement of risk, is a statistical measure that calculates the degree to which returns have fluctuated over a given time period. A higher standard deviation indicates a higher level of variability. Indexes are unmanaged, do not incur fees or expenses, and cannot be invested in directly. For more information on indexes, please see schwab.com/indexdefinitions.
The diversified portfolio is a hypothetical portfolio consisting of 18% S&P 500, 10% Russell 2000, 3% S&P U.S. REIT, 12% MSCI EAFE, 8%, MSCI EAFE Small Cap, 8% MSCI EM, 2% S&P Global Ex-U.S. REIT, 1% Bloomberg U.S. Treasury 3-7 Year Index, 1% Bloomberg Agency, 6% Bloomberg Securitized, 2% Bloomberg U.S. Credit, 4% Bloomberg Global Agg Ex-USD, 9% Bloomberg VLI High Yield, 6% Bloomberg EM, 2% S&P GCSI Precious Metals, 1% S&P GSCI Energy, 1% S&P GSCI Industrial Metals, 1% S&P GSCI Agricultural, and 5% Bloomberg Short Treasury 1–3 Month Index. Including fees, expenses, and taxes in the diversified portfolio would lower returns. The portfolio is rebalanced annually. This hypothetical example is only for illustrative purposes. Diversification and asset allocation strategies do not ensure a profit and do not protect against losses in declining markets. Investing involves risk, including loss of principal. Past performance is no guarantee of future results.
4. Understand fees and taxes.
- Markets are uncertain; fees are certain.
- Pay attention to net returns.
- Manage taxes to help maximize returns.
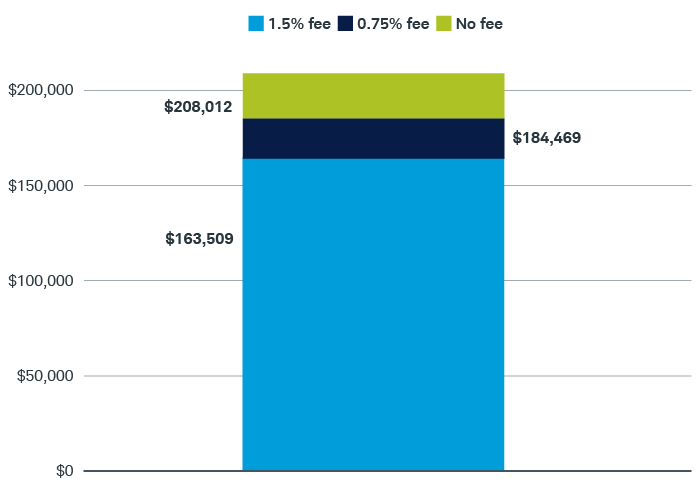
Fees can eat away at your returns.
$3,000 is invested in a hypothetical portfolio that tracks the S&P 500 index every year for 10 years, then nothing is invested for the next 10 years. Over 20 years, lowering fees by three-quarters of a percentage point would save nearly $21,000.
-
Source: Schwab Center for Financial Research with data from Morningstar. The hypothetical investor invests $3,000 on the first day of January of every year for 10 years. Returns are assessed a fee at year-end. The hypothetical portfolio tracks the S&P 500 index from January 1, 2006, to December 31, 2025, with $3,000 in annual contributions invested for just the first 10 years. In scenarios involving fees, those fees are paid annually each year. Chart does not take into account the effects of any possible taxes. This hypothetical example is only for illustrative purposes. Indexes are unmanaged, do not incur management fees, costs, and expenses, and cannot be invested in directly. Investing involves risk, including loss of principal. Past performance is no guarantee of future results.
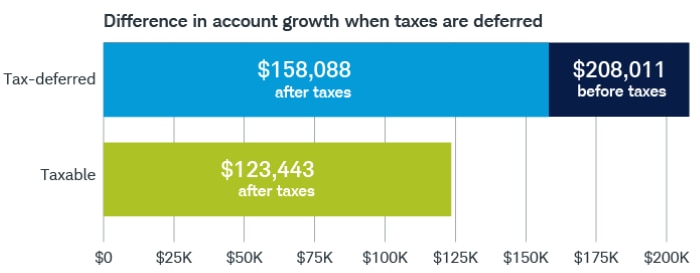
Try to minimize taxes.
$3,000 is invested in a hypothetical portfolio that tracks the S&P 500 index every year for 10 years, then nothing is invested for the next 10 years. Placing investments in a tax-deferred account can result in higher ending wealth after 20 years.
-
Source: Schwab Center for Financial Research with data from Morningstar. The account earns capital appreciation and dividends. Dividends are assumed to be reinvested when received. The investor makes a lump-sum withdrawal in year 20, when they are in the 24% marginal tax bracket. In the taxable scenario, the investor is in the 24% marginal tax bracket and after taxes invests $2,250 in a hypothetical portfolio that tracks the S&P 500 index every year for 10 years. They invest nothing for the next 10 years, leaving their money fully invested. The account earns dividends, which are taxed at 15%, and recognizes capital gains every five years during portfolio rebalancing. Capital gains are taxed at 15% with net proceeds reinvested. Performance is based on historical returns of the S&P 500 index from January 1, 2006, to December 31, 2025. Indexes are unmanaged, do not incur fees and expenses, and cannot be invested in directly. This information is not a specific recommendation, individualized tax, legal, or investment advice. Tax laws are subject to change, either prospectively or retroactively. Where specific advice is necessary or appropriate, individuals should contact their own professional tax and investment advisors or other professionals (CPA, Financial Planner, Investment Manager, Estate Attorney) to help answer questions about specific situations or needs prior to taking any action based upon this information. Investing involves risk, including loss of principal. Past performance is no guarantee of future results.
5. Build in ways to manage big losses.
- Modest temporary losses are tolerable for most investors, but recovery from significant losses can take years.
- Consider cash equivalent investments and bonds for diversification and to lower volatility in part of the portfolio.
- While advanced orders and complex products are ways to manage risk, the average long-term investor is more likely to use traditional portfolio techniques like dollar-cost averaging and rebalancing.
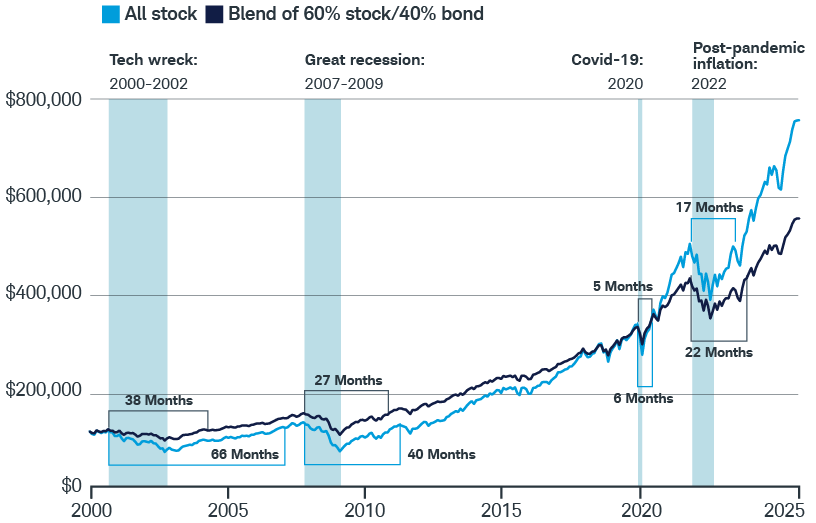
Steep declines are hard to bounce back from.
Down markets are unpredictable and can have a dramatic impact on personal plans like retirement. In several recent downturns, an all-stock portfolio tended to take longer than a diversified portfolio to return to its prior peak.
-
Source: Schwab Center for Financial Research with data from Morningstar. Time period examined is from January 1, 2000, to December 31, 2025. Stocks are represented by total annual returns of the S&P 500 index, and bonds are represented by total annual returns of the Bloomberg U.S. Aggregate Bond Index. The 60/40 portfolio is a hypothetical portfolio consisting of 60% S&P 500 index stocks and 40% Bloomberg U.S. Aggregate Bond Index bonds. The portfolio is rebalanced annually. Returns include reinvestment of dividends, interest, and capital gains. Fees, expenses, and taxes would lower returns. Diversification and asset allocation strategies do not ensure a profit and do not protect against losses in declining markets. Indexes are unmanaged, do not incur management fees, costs, and expenses, and cannot be invested in directly. This hypothetical example is only for illustrative purposes. Investing involves risk, including loss of principal. Past performance is no guarantee of future results.
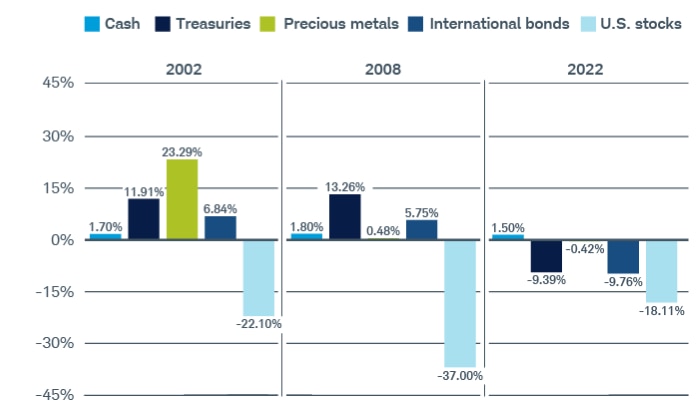
Defensive asset classes have performed better when stocks decline.
During two recent market downturns, defensive assets had positive returns—significantly outperforming U.S. stocks.
-
Source: Schwab Center for Financial Research with data provided by Morningstar. The three periods were selected to show how defensive asset classes performed when U.S. stocks decrease by more than 15% annually in the 20-year time period from January 1, 2002, to December 31, 2023. Indexes representing each asset class are S&P 500 TR Index (U.S. stocks), FTSE U.S. 3-Month Treasury Bill Index (cash), Bloomberg U.S. Treasury 3-7 Year TR Index (Treasuries), S&P GSCI Precious Metal TR Index (precious metals), and Bloomberg Global Aggregate Ex-U.S. Bond TR Hedged Index (international bonds). TR in index names refers to "total return." Returns assume reinvestment of dividends and interest. Fees, expenses, and taxes would lower returns. Investing involves risk, including loss of principal. International investments involve additional risks, which include differences in financial accounting standards, currency fluctuations, geopolitical risk, foreign taxes and regulations, and the potential for illiquid markets. For illustrative purposes only and are not intended to be, nor should they be construed as, a recommendation to buy, sell, or continue to hold any investment. Indexes are unmanaged, do not incur management fees, costs, and expenses, and cannot be invested in directly. Past performance is no guarantee of future results.

6. Rebalance regularly.
- Be disciplined about your tolerance for risk.
- Stay engaged with your investments.
- Understand that asset classes behave differently.
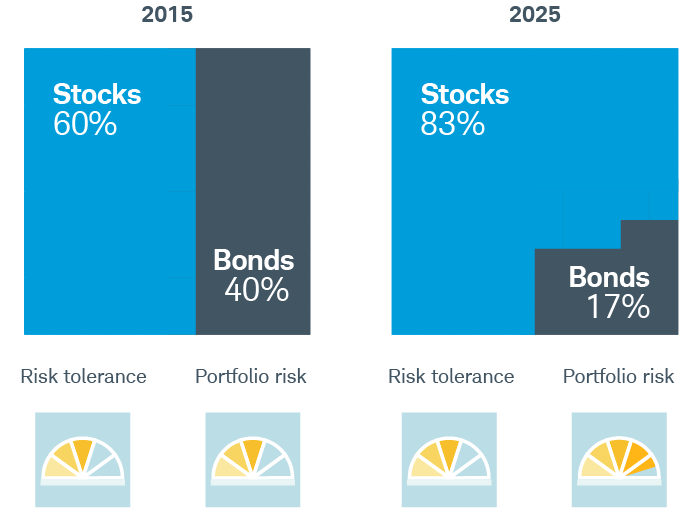
Regular rebalancing helps keep your portfolio aligned with your risk tolerance.
A portfolio began with a 60/40 allocation to stocks and bonds and was never rebalanced. Over the next 10 years, the portfolio drifted to an allocation that was 83% stocks and only 17% bonds—leaving it positioned for larger losses.
-
Source: Schwab Center for Financial Research with data from Bloomberg. The hypothetical portfolio above is composed of 60% stocks and 40% bonds on January 1, 2015, and is not rebalanced through December 31, 2025. Asset class allocations are derived from a weighted average of the total monthly returns of indexes representing each asset class. The indexes representing the asset classes are the S&P 500 index (stocks) and the Bloomberg U.S. Aggregate Bond Index (bonds). Returns assume reinvestment of dividends and interest. Indexes are unmanaged, do not incur fees and expenses, and cannot be invested in directly. Rebalancing does not protect against losses or guarantee that an investor's goal will be met. Rebalancing may cause investors to incur transaction costs and, when a non-retirement account is rebalanced, taxable events may be created that may affect your tax liability. Investing involves risk, including loss of principal. Past performance is no guarantee of future results.
7. Ignore the noise.
- Daily financial news stories may be more relevant to short-term traders than long-term investors.
- Markets fluctuate up and down.
- Stay focused on your plan.
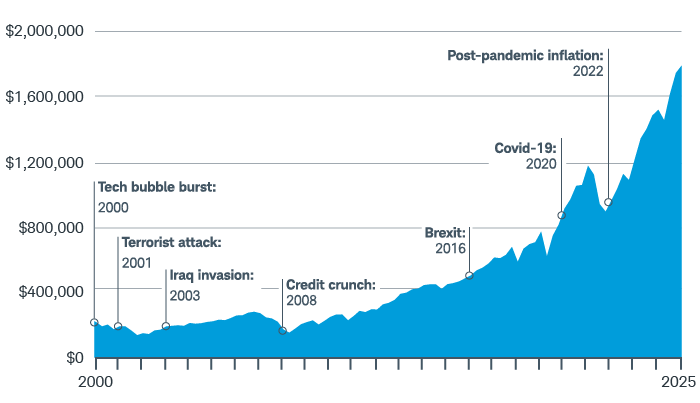
Progress toward your goal is more important than short-term performance.
The market has experienced numerous setbacks over the decades—but the optimist who invested early and stuck to their plan would have been rewarded over the long term.
-
Source: Schwab Center for Financial Research with data from Morningstar. The chart illustrates the growth from January 1, 2000, to December 31, 2025, of a portfolio with an initial investment of $5,000 in the S&P 500 Index on January 1, 1970. Taxes would lower returns. Indexes are unmanaged, do not incur fees and expenses, and cannot be invested in directly. This hypothetical example is only for illustrative purposes. Investing involves risk, including loss of principal. Past performance is no guarantee of future results.

#1 Broker Overall ranking by Investor's Business Daily.
CTA
Schwab can help you take action on these principles.

Questions? We're ready to help.
-
 Call
Call -
 Chat
Chat -
 Visit
Visit