Upbeat music plays throughout.
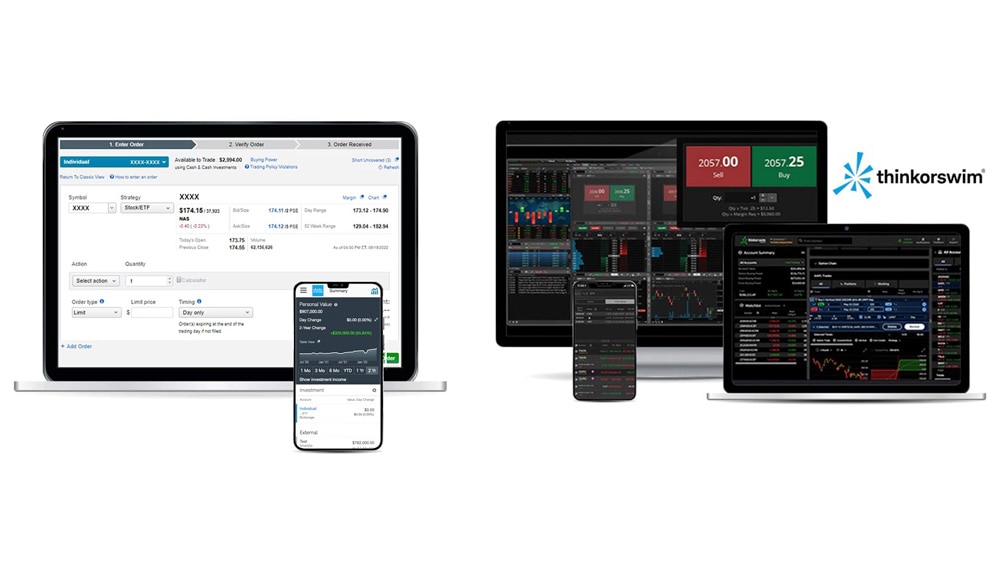
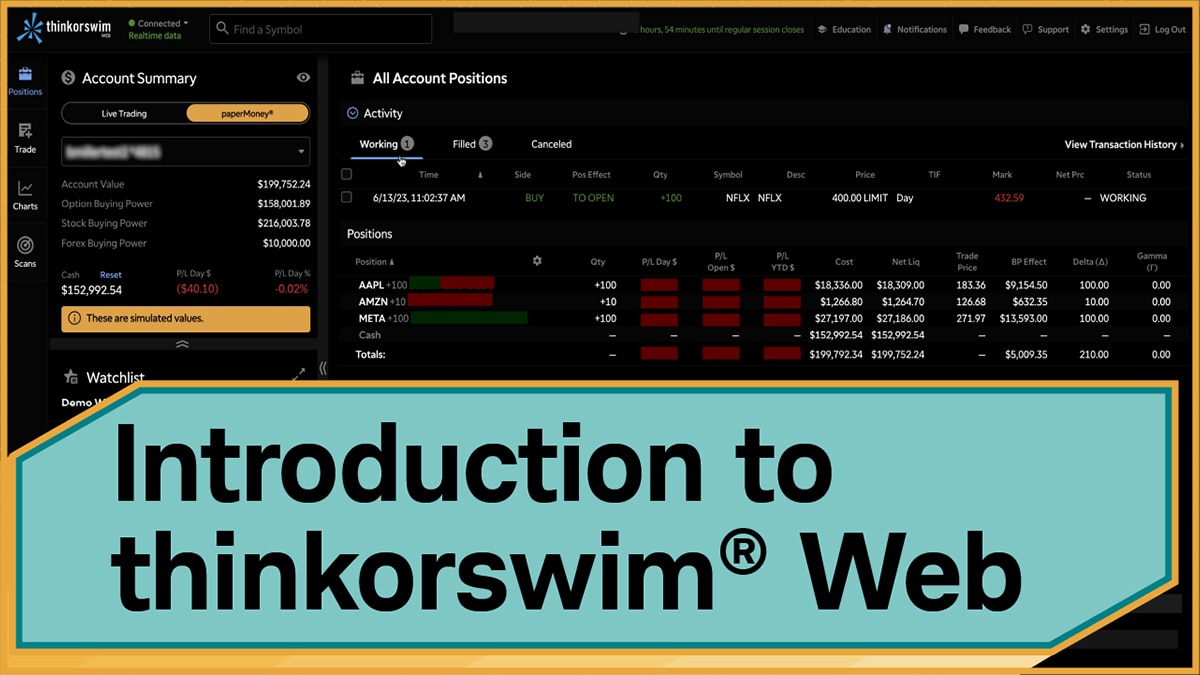
Narrator: Hey traders. I'm Sarah Tyson, a Trader Service senior specialist here at Schwab, and in this video I'm going to give you a walkthrough of our trading platform thinkorswim® web, a web-based trading platform with many of the features and functionality that you're familiar with on thinkorswim desktop, however now available on a web-based trading platform.
So, in this video I'm going to give you a walkthrough of the layout of thinkorswim web and show you some key features and functionality like watch list, charts and how to place a trade on both stocks and options.
So let's jump in and get started.
One of the main advantages to using thinkorswim web is that there's nothing to download or install. Simply grab your nearest device, whether your phone or a tablet, or you can go to your computer or laptop and simply launch your web browser.
Animation: The mouse clicks in the address bar of a browser and types trade.thinkorswim.com bringing up the thinkorswim web login page.
Narrator: From here, there's two ways to get thinkorswim web. The first is to navigate directly to trade.thinkorswim.com. From here, you can simply enter your username and password and log into thinkorswim web.
Animation: The mouse clicks in the address bar of a browser and types thinkorswim.com bringing up the thinkorswim website. The mouse then clicks on a button labeled Log in to thinkorswim web in the upper right-hand side of the page.
Narrator: The second way to get to thinkorswim web is to navigate to thinkorswim.com and log in right from the landing page.
Okay, let's begin with the layout of thinkorswim web.
Animation: The mouse traces along the top of the platform pointing at the different options. It clicks on Feedback opening a dialog window.
Narrator: Along the top we have a connection status and the ability to enter or look up a symbol. On the other side, we have the time until the regular market close, Education, Notifications, and you can also send feedback to the developers right here.
Animation: The mouse clicks on Settings, opening new window.
Narrator: And finally, we have Settings. Here we can change the language, change the quote color, or even change the color of the entire site. Now if I want to see the site in light mode, I simply click right here. And to change it back to dark mode, I'll click there again.
Animation: The Settings window closes, and the mouse moves to the left side of the screen. It points at an icon that looks like an eye. When the eye is clear, the account numbers are visible. When the eye is crossed out, the account numbers are hidden.
Narrator: Over on the left is your account summary section where you can get information about your account. So, if you want to hide your personal information while you're using the site, just click the icon that you see here. This will hide your personal information across the entire site. Now just go ahead and click it again to unhide them.
You can also switch to paperMoney® from the same section in case you want to test out any of your trading strategies. For this demo, I'm going to stay on paperMoney.
Okay, let's start customizing the platform, and we'll do that by creating a watchlist.
Animation: The mouse moves down to the Watchlist section of the left side panel. Then it clicks on the New Watchlist button. An empty watchlist appears with a Find a Symbol box.
Narrator: So, we're going to select New Watchlist and let's call this one Demo Watchlist. And we're going to add the FANG symbols just as an example.
So, we'll start with Meta, formerly known as Facebook, Apple, Amazon, Netflix, and Alphabet.
Now I've got all these symbols on my watch list. If you want to move these columns, I just drag and drop to change their order.
For instance, if I wanted to see the Mark Change before the Mark or to change their order back, just drag and drop again.
All right, let's go to a symbol, and place a trade. I can do this in one of two ways.
Animation: The mouse moves to the top of the platform and clicks in the Find a Symbol box.
Narrator: First, I'm going to go to our symbol entry and type the symbol for Microsoft. Now on this page you can see we have the symbol, company name, and the ability to add it to our watchlist.
And you can see here this feature will allow me to add it to the one we just created which we call Demo Watchlist. So, clicking Demo Watchlist, and you can see that Microsoft is now added to the watchlist we just created.
Animation: The mouse moves back to the left panel Watchlist section. It then clicks on GOOGL which brings up the stock for Alphabet.
Narrator: The second way to get to this page is by clicking symbols on the watchlist so we can navigate to Alphabet, Netflix, Amazon, and Apple. And each one I click on is going to load in the symbol area.
Animation: The mouse clicks on the Buy button and a Trade window appears at the bottom of the screen.
Narrator: Okay, let's buy 100 shares of stock. After clicking on the Buy button, an order will appear in the trade table where I've got a Buy-Sell toggle that I can toggle by clicking. And I can select the number of shares in this case 100, but I can change that to say 500 or any number really that I want. In this case, let's go back to 100.
As I update the quantity information about my order is going to update in real time. We have a bid and ask spread here and it will also show the mid price, and you'll see that when the mid is between the bid and the ask. So, that will show up depending on the market.
Now I have the limit price for my order, which we're going to go ahead in this case and set it to let's say $183, which is right below the current market.
We also have our order types: LIMIT, MARKET, MARKET ON CLOSE, LIMIT ON CLOSE, STOP, STOPLIMIT, and TRAILSTOP. I'm sending a limit order in this case.
We have our time and force options: Day and Good Till Cancel. And I can also send those for the extended session.
And we'll go ahead and review the order where I'll get some order confirmation details.
And we have an order summary and some information about the order like Resulting Buying Power, Buying Power Effect, and the Resulting Buying Power for Options, as well as some quote data.
Animation: The order is sent and a window appears in the upper right hand corner showing the order has been submitted.
Narrator: Now let's go ahead and send that order. And now we can see the orders working in the market on our trade table. And now that we have an order for a hundred shares working, I'm going to show you how to edit this order so that you can change the price and get a fill. First, we're going to click Edit Selected, and you'll notice now I'm editing this order in a new order in the trade table.
Let's go ahead and make this a MARKET order.
So that's going to fill at the current market price. Let's review that order and send it.
You'll notice my fill comes in on the upper right corner, and once that information is gone, I can also access it in the notification section.
Here I have my information about my fill, my buy, as well as my edit. Once I'm done viewing notifications, I can just clear all of those so that any new notifications that come in will be visible.
Animation: The mouse clicks on the Positions icon on the left of the screen.
Narrator: Right now, I'm looking at my positions.
And above that you'll notice we have the activity bar where you can monitor your Working, Filled, and Canceled orders.
Animation: The mouse selects the box next to the working order and then clicks on the Cancel Selected button. Then a confirmation alert appears on the top of the screen.
Narrator: Let's go ahead and quickly cancel that working order so that we can take a look at just our positions. I can see that confirmations come through that the order has been canceled.
Animation: The mouse clicks on the Apple symbol in the Positions menu.
Narrator: Now let's close one of these positions. We'll go into our Apple position, which we opened earlier. To close this position, click Close Selected, and an order to sell the position will come up on the screen.
Let's go ahead and make this a MARKET order so that we can see what happens once the position is closed.
I'm going to click Review and get our order confirmation again, and then send that closing order. Now our position in Apple is closed.
You can see that on the right in the All Accounts Positions preview.
Now let's imagine we want to put a stop order on our Meta shares. First, we'll switch to Meta by clicking on META in the position's preview, and then we'll start closing this position by clicking on Close Selected.
But the difference is this time we're going to change our LIMIT order to a STOP order. We'll specify a lower price, like $250. We're going to review that order and then send it.
Now you'll notice we have both our Meta position as well as a stop order to close that position should Meta go all the way down to 250.
So now that we've got our stop order on, we can go back to our All Account Positions and select Activity to monitor this working order. Let's take a look at some of the things we can do on this page.
Animation: The mouse briefly hovers over some of the columns.
Narrator: You'll notice that right now I have some data. For example, Quantity, some profit and loss numbers, Cost, Net Liq, Trade Price, Buying Power Effect, and then some of the greeks, which may not be as applicable to this portfolio since it's all stock.
Animation: The mouse hovers on the gear icon. Then clicks on the icon to reveal the Customize Columns screen. The mouse clicks the minus signs for each greek. Then it clicks the Close button.
Narrator: So, if we wanted to remove that to do that, I'll click on the gear wheel icon and remove the greeks by selecting them here.
Okay, now let's take a look at charts on thinkorswim web.
To start, we'll click on Microsoft and go to Microsoft's trade page.
Beneath the trade table is the chart. I can hover my mouse over the chart giving me cross hairs. That'll tell me what date and price level my mouse is located at. So, I can also see in the top left-hand corner of the chart the Open, High, Low, and Closing prices for the candle that my mouse is currently hovered over.
So, for example, if I wanted to look at last week's close, I could hover over the candle for last week and see the close in the top left hand corner of the chart. If I wanted to change how much data I'm viewing, which is currently set to one year, I can go to the top right click on 1 Year and then change to say one Week where I'll now be viewing the one-hour candles for the past five trading days.
Okay, let's show you how to buy a call option on thinkorswim web.
Let's go to the symbol for Netflix and we can take a look at some ways that we can buy a call. There are two ways that you can buy a call on this page. First is to simply start an options trade from the trade table, which will move you right into the option trade ticket where you can select the expiration and the strike of the call.
All of the other controls on the order ticket are going to be the same as we had in the stock example.
The other way is to start the call option order from the Option Chain.
So, we'll expand the Option Chain and then we'll pick the expiration we want to trade. If for instance, I wanted to buy a call that expires in 38 days, I would expand the July 21, 2023 expiration with 38 days left.
In the option chain, we have the calls on the left and puts on the right. And the strike price is in the middle.
All of these options expire in 38 days. So, let's go ahead and find the 440 call and we're going to buy that call by clicking on the ask price. If I wanted to sell that call, I would click on the bid price. Or if I wanted to change that to another call, I could simply click again to remove it and let's say buy the 445 call.
So, let's go ahead and go down to review that order. You can see that the order I'm reviewing has many of the same properties as we saw before. Currently, it's set to buy 10 contracts. So let's go ahead and change that to one.
I have the July 21 expiration here, the 445 strike that I've selected and is currently set to buy at $20.40, which is the current asking price for the call. Leave that as a limit order, and then when you're ready, click Send.
Animation: The mouse scrolls down to the Netflix graphs and a risk profile for the newly created long call position is shown.
Narrator: To the right, we have the profit and loss profile for this long call that we've selected in the trade table.
We have the green shading to represent our potential profit and the red shading to represent our potential loss. And then you'll see this dotted green line, which represents the current price of Netflix.
One thing you'll also notice is that we have a dotted blue line, and this represents our profit and loss as of today, as opposed to say the profit and loss at expiration, which is in 38 days.
Now that's represented by the green and red shaded line.
And that's a quick look at thinkorswim web. For more information on this platform as well as thinkorswim desktop and mobile, head over to thinkorswim.com.
If you're looking for other great investor education, check out Insights & Education on schwab.com. And finally, if you're looking for some great video content about investing and trading in the markets, subscribe to our YouTube channel.
Thanks for watching and happy trading.
On-screen text: [Schwab logo] Own your tomorrow®


