Your Guest Pass is active.

How to use your thinkorswim® Guest Pass:

Once you've signed up for a Guest Pass, use the credentials you created to access the simulated market environment paperMoney®1 within any of the thinkorswim platforms.

thinkorswim desktop

This flagship of the platform suite is a fully customizable, no-holds-barred trading experience. (After downloading thinkorswim desktop, select the gear wheel on the bottom left to access Guest Pass in the drop down menu.)

thinkorswim mobile

A one-stop trading app that packs many features of the thinkorswim desktop into the palm of your hand.2


Download thinkorswim on the Apple App Store Get thinkorswim on Google Play

thinkorswim web

Taking the essential trading functionality from the thinkorswim desktop, this platform is streamlined and optimized for web access.

Take thinkorswim for a test-drive—no Schwab account required.

With a thinkorswim Guest Pass, you'll have 30 days to explore and use any of our thinkorswim trading platforms. Test your strategies in a simulated market environment using industry-leading charting, analysis, and trading tools.

A hassle-free way to try thinkorswim

No need to open and fund a Schwab account or transfer positions.

Analyze, trade, and monitor in a simulated market environment

Use thinkorswim to test your strategies and explore new ones. 

$100,000 of virtual buying power is yours to use

Trade equities, options3, futures4, and forex4 with simulated buying and margin features.
 

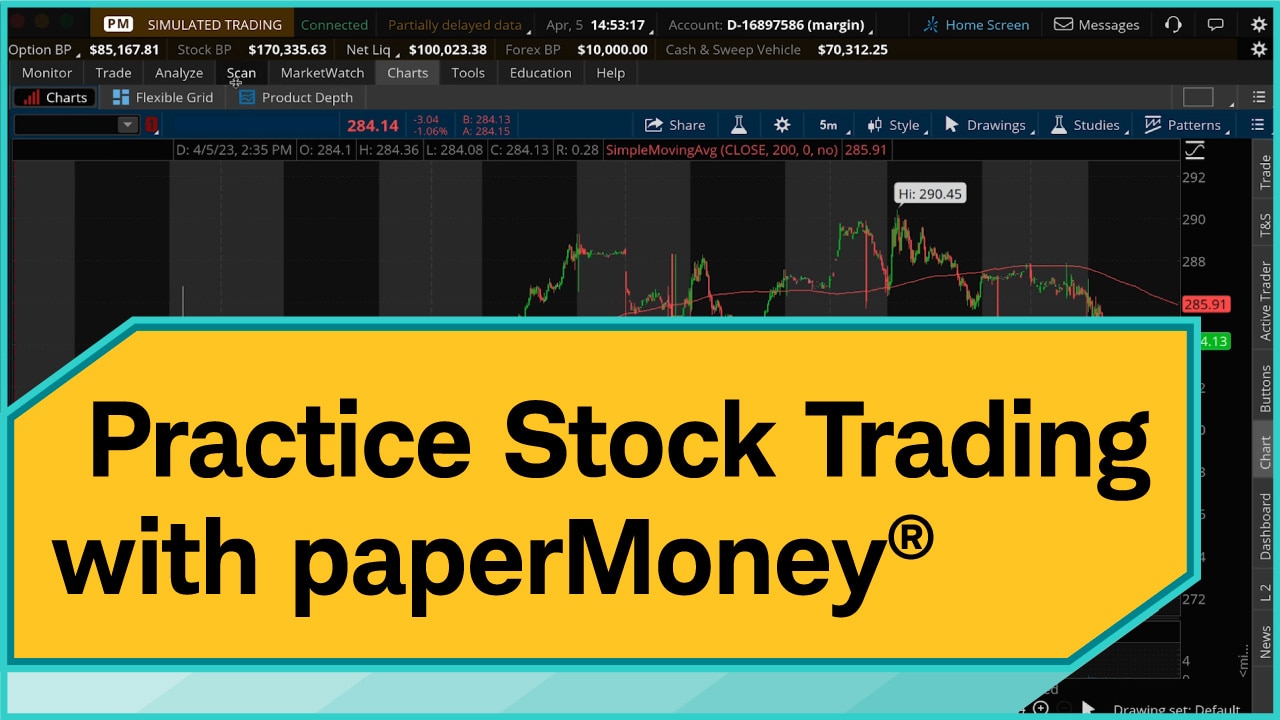
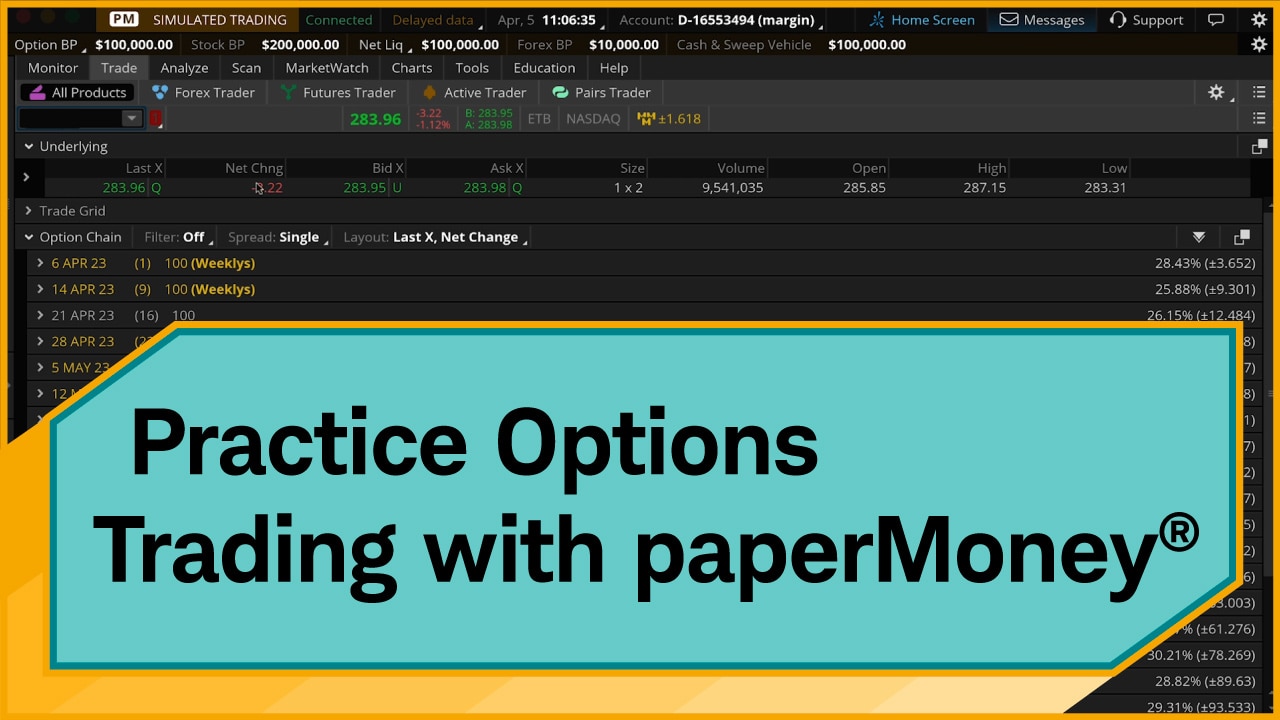
Maximize your thinkorswim Guest Pass experience with these helpful tutorials.

As a Guest Pass user, you'll be using the same paperMoney simulated trading environment that clients have access to. Check out these videos to learn how to test your strategies risk-free.

Narrator: Hello, traders. I'm Jeremy Kuhlman. The stock market can be intimidating, especially for new traders and investors. And that's why Schwab offers thinkorswim® paperMoney®, a free virtual trading platform that lets you practice buying and selling stocks without risking real money. It's also a great way to learn how to use thinkorswim, our award-winning trading platform. Now, in this video, I'm going to show you some of the ins and outs of paperMoney, how it differs from your live account, and also show you some key features I think every stock trader should be familiar with when using thinkorswim.

Now, let's jump in.

Animation: paperMoney on the thinkorswim platform appears with home screen open.

Narrator: Okay, so now that we're logged in on paperMoney here, we're going to come up and look along the top edge of the platform. You will see that we are logged into simulated trading, and we are connected to the internet, and you can look over here that we do have partially delayed data. By default, paperMoney comes with a 20-minute delay. To the right of that, we have our date and time and, to the right of that, we have our account selector.

With paperMoney, you get two different accounts here, two different account types: a margin account and an IRA account that you can test out trading in. I'm going to go ahead and select the margin account and if you look over here on the left-hand side, you have $100,000 in buying power. Both accounts actually come with a $100,000.

As a stock trader, the first thing I'm going to want to do is add stock buying power to our account information field over here on the left. We're going to do that by clicking on this menu icon. We're going to come down to Customize gadget. We're going to go to the left-hand side and type in the word stock and you'll see right there: Stock Buying Power. I'm going to click on that, go down to Add Item, then go ahead and click OK. Now, you see there's another line here down below the cash and sweep vehicle that says Stock Buying Power $200,000, and that's because when we're trading stocks, we actually are given additional leverage of two times the buying power you have for options. So, we definitely want to be able to see this as a stock trader, so we can understand exactly how much leverage and buying power we have.

Okay, next, let's start customizing this platform as a stock trader. So, the first thing we're going to do is work on the left-hand side. We're going to create a watchlist. Every stock trader should have a list of stocks that they're interested in. The way we're going to do that is come down to the lower left-hand corner, we're going to go ahead and click on this gear wheel down here and you notice we have three different gadgets right now. We're going to simplify the left side and get rid of Live News and get rid of Quick Chart and just keep our Watchlist. Now, we're going to go ahead and come down to the bottom of this watchlist, hover over this line until you see a double arrow. I'm going to click and drag that all the way down to the bottom, so we get the maximum amount of real estate. Let's go up here to select watchlist and we'll go down we'll go through some of these public watchlists. You can actually pull up your positions and some things but we're going to go over and go here we're going to pull up the Dow Jones.

You can mouse through some of these public lists and let's go to Public (2 through F) and we're going to go over here and see Dow Jones Industrial Average®. Let's go ahead and add that and you can now see we have the entire Dow Jones over here in the left-hand side.

Okay, so now let's say we want to look at a stock that is not in the Dow Jones. We want to look up a symbol or look up a company name. So, what we're going to do is come up here to the top and go click on the Trade tab. We're going to go to the All Products subtab and you notice up here at the top it asks us to enter a symbol. So, if we know the symbol of the stock we want say, Apple, we're going to go ahead and type in the symbol that's AAPL. I'm going to go ahead and press and enter; that's going to load the stock, load our quote along the top here.

Now, if we don't know the symbol for a stock, how are we going to do that? Well, in this little search box, it's actually a search box as well as a symbol box, we're going to type in Apple and now the platform is going to search with anything with the word Apple in it. You can see there's some other stocks that come up in here, but this is the one we're looking for: Apple. I'm going to go ahead and click right on that.

Now, a really cool thing, and a really helpful thing on this platform that we can do is start to connect areas together. We use that using a colored-linking system, and if you look up here next to the symbol box, we have a red number one. Well, on the left-hand side on our watchlist for the Dow Jones, we have a yellow number two. In order to link these two pages together, we actually want to click on this two and match it to the color that we have on the Trade tab. So, when I click on red here, actually what you're going to notice is that Apple automatically became highlighted and that is actually because that's the one we're looking at in our Trade tab right now. This allows you to simply change symbols by clicking on them: CRM we can pull that over into the Trade tab, AXP. Or even use your up/down arrow keys on your keyboard to mouse down and arrow down through this list of stocks and see them change.

Now let's talk about placing a trade. We're looking at Cisco right now and up along the top of the platform there's a bid ask. Now, one of the most common questions I get is, "Where is the buy sell button on this page?" and you'll notice there isn't one. Well, to create an order on thinkorswim, what we're going to do is use the bid and the ask. If you look right here, we have an ask price of $51.97 and bid price of $51.96. If you hover over the ask price, the platform will pull up a little buy right next to your cursor there and if you hover over the bid, guess what? There's a little sell over there.

So, let's start by creating limit order to buy Cisco. I'm going to go ahead and click on this price and what you'll notice is the bottom of the platform opens up an order ticket.

Animation: Arrow hovers over and clicks on the $51.97 ask price above the option chain and opens the Order Entry Tools section below the option chain.

Narrator: Just so we have the right amount of real estate here, I'm going to go ahead and collapse the left sidebar and let's look what we have down here. So, it tells us it's a stock, it tells us it's a buy, it's for a hundred shares, which is a default, and it's a limit order.

Now, what if we want to change our share quantity? Well, we have these nice plus minus buttons here; when you move those up it actually is going to move your order quantity up by the default amount. So, I'm moving it up 100 at a time. If you want to do an odd lot or some different amount than 100 at a time, you can actually highlight and type in the quantity you want. Say we want 25 shares.

And we can follow that over here on the right and we have a limit order. Now, a limit order is where you put in a price that you want to pay; you only receive this price or better with a limit order. I currently have it in there at $51.98, which is the current ask price of the stock. Now, we could definitely lower that price a little bit if we wanted to, but right now let's just go ahead and send this off to the market and see if we can get a fill, and we'll look at changing the price a little later on. We're actually going to leave this on DAY and we're going to come down over here and click on Confirm and Send.

Now this is a good place to review your trade.

Animation: Order Confirmation Dialog box appears with details of the order.

Narrator: It's the last chance you have before you send it out to the market. So, you see we're buying 25 Cisco at $51.98 limit order and that's going to be just good for the day. Let's go ahead and click on Send and now our order has been sent to the market, and we got a fill.

Okay, now this time let's take a look at buying a stock with a market order. Now we're going to go up and pull a different stock up here. Let's use Microsoft as an example and you'll notice it still pulls up the same page here and we have our bid and ask price. Remember, to buy we're going to go over to the ask price and click on that price right here and that's going to open our order ticket down here at the bottom of the page. It's a stock order again for 100 shares, Microsoft, and, by default, it pulls up a limit order just like it did before.

Now this time we're going to go over here where it says LIMIT, and click on that, and we're going to switch it to MARKET, and what I want you to notice is that the price goes away. With a market order, you don't have any control over the price. Whatever the ask price is at the time the order is received, is what you'll buy. Now, if we click on that and go back to limit, you can see we now have control over the price. We can lower that price to try to get a little bit of a better fill or we could even kind of highlight that price and type in $280 or something like that. But, for the moment, we wanted to use a market order and we're going to go ahead and click on this, switch it back over to MARKET. Going to go ahead and click on Confirm and Send, no price now, and we're going to go ahead and click on Send.

Now after that order filled, how do we monitor the position? How do we see what price we paid? Well, we're going to go up here to the Monitor tab, to the Activity and Positions subtab and you'll notice we see an area here called Today's Trade Activity. We have a working order section. Now none of ours are working, they both filled, and we have a filled order section. You can see we have two fills.

Let's go ahead and open that up and what we can see here is that when we bought Microsoft, our market order filled at $283.90, and the limit order for Cisco, that one filled at $51.91. Now that we've bought these stocks, they are called positions and let's come down here to the Position Statement area. You'll notice we see Cisco, our quantity, our trade price of $51.91, and the mark price of $51.88. That's up $0.0625, now it's $0.07 and, at the moment, we're down about $0.50 on that. It's very important these two numbers here profit and loss open, that's since buying the stock, and profit and loss day. Those are actually the same today because we bought the stock today. Go look at Microsoft in the same way: 100 shares purchased at $283.90, currently at $283.99, and we're making about nine, well, now $7 on that stock.

Okay, now that we own these two stocks, let's talk about closing them out. We're going to go over here first to Cisco and then hover over the symbol here and right click. And when you do that, you're going to get this little field here that says Create closing order. Now, if we look on the right-hand side, we have three different ways to close out.

For this first one, we're going to go ahead and choose a limit order. You see it says "sell 25 Cisco at $51.88 limit." That is the current bid price and we click on that, what the platform will do is take us over to the Trade tab with a sell limit for the same quantity of shares we own, at the current bid price, of $51.89.

Now we want to sell this if the stock goes up to capture profit. So, what we're going to do is, say, maybe it's going to go up to $52. Well, I'm going to go ahead and click in here, type in 52, and that's where we would sell if it reaches that price. Now it might get there today, it might not, it might take a few days. So, we want to make this order good till canceled. That makes the order last beyond today's trading day.

Animation: Arrow hovers and clicks on DAY, then selects GTC from dropdown menu.

Narrator: We'll go ahead and click on that, and we're going to go ahead and click on Confirm and Send, and click on Send.

After you send an order, you definitely want to go check and see if it's working. Let's go back up here to the Monitor tab and you'll see over here on the right-hand side: we're working at $52, the mark price is $51.90.

Now, let's talk about using a stop order. A limit order was there to capture our profit. A stop order is there to protect us against loss. So, for Microsoft, we're going to go ahead and hover over the symbol, same process, right click, go up here to Create closing order and this time we're going to go over here and select with STOP. It's going to take us back to the Trade tab with the same quantity share of a sell stop at $1 below the market by default. Now, that might be too close to the market price.

So, we're going to go ahead and change that. Let's go ahead and say we'll sell out if it reaches $280. Go ahead and press enter after you do that. And same deal as before, we definitely want to make sure that this order lasts longer than one day. Click on that and switch it over to good till canceled. We're going to go ahead and click on Confirm and Send and click on Send.

Go back up to Monitor one more time and check that we have both of these working orders here. You can even see down your Position Statement, we have little "sells" next to the symbols that let us know that we have these orders out there to protect us and to potentially capture profit.

Okay, now one great feature of thinkorswim paperMoney here is that if you ever make a mistake, we have the capability of correcting that. Now what I've done here is I've actually put in a position for Nike. I filled this order, and I did not mean to buy this stock. I didn't mean to buy 125 shares.

Now if we don't want to reset the entire account, what we can do is actually adjust an individual position and the way that's done is you hover over the stock and you go ahead and you right click on it, and you'll see right here it says Adjust position. I'm going to click on that.

Now I accidentally bought 125 shares and so what I want to do is do the opposite quantity in a negative value, so minus 125 and, just for my sake here, I want to do it as if I sold them at the exact same price and so I'm going to come up here and I bought that at $120.99. So, then go ahead and put the same price in there, come down here, click OK, and what you'll notice is I now have zero position in Nike, same trade price profit/loss day and open are both zero. This is a great capability you have in case you mess up you don't want to adjust or reset your entire account; you just want to remove one individual position.

Now in the same way that we just adjusted that position, what if we made a mistake with one of our orders and we actually needed to change the price of our order? Well look up here, I put this in at $52 limit. Maybe I'm feeling like that's a little too tight to the price right now. So, I want to go ahead and change the price of my limit order.

The way I would do it is actually go ahead and right click on that order and you see I have a choice to either cancel it or I can cancel and replace it and actually move that limit price higher to make sure I get the right fill that I'm looking for.

Now, let's say I actually want to change this limit order price. I'm going to go ahead and click on this and instead of $52, I'm actually going to be looking for around $55. I'm going to go ahead and change that price. Remember, press enter. I'm going to go ahead and click on Confirm and Send again and then Send. We're going to come back up here to the Monitor tab, and you'll see that our order is now working at $55 limit order, and we've successfully replaced that $52 limit with a new $55 limit.

Now, next we're going to look at a couple different ways that we can continue to customize this platform as a stock trader. We're going to go back up to the Trade tab. I want you to look over here on the left-hand side. You're going to find this section here that says Trade Grid. Go ahead and expand that, and you'll see we have three little gadgets here.

Now the first thing we're going to do is come up to the menu box on this Trade Grid. I'm going to click on that and go down to Gadget. Now every trader should be looking at the news. So, we're going to go over here and select Live News. Now the next step here is to click on this little chain link, select Red and, guess what? It's going to fill in with Cisco. These two areas are now connected.

Now if you remember before, when we're talking about buy sell button, well guess what? We actually do have one in here after all. I'm going to click on the same menu button, come down to Gadget, and then go over and select Dashboard. Last step, we're going to go ahead and link this up to red and now we have a buy and a sell button for the same stock that we're looking at up above.

This is also a great spot where you can change the default quantity of the orders you're going to trade. When you click on this, say you want to trade 10 shares at a time, or just go ahead and type in 10. And now guess what? Every time I click on this buy order, we're going to go ahead and get a 10-share stock order down at the bottom.

Now the last gadget we're going to look at is one that's a little bit more advanced. I'm going to go ahead and click on this menu button, go over here and select Level II. Last step, click on link and link it up to red. So, now we can see all this nice Level II data for Cisco, so the bid, ask, and size and so forth.

Now, remember we linked all of these up to red. So, I'm going to follow this all the way over to the left-hand side and bring our left sidebar back. And notice what happens when I click on any symbol in the Dow Jones; all of these gadgets change to the same symbol. I can arrow down through them again and create buys for a single stock very quickly. Select a stock from here, click buy, look at the Level II, and look at the news, all with one single click.

Now the next feature I'd like to show you is the Charts tab. Let's go ahead and mouse up to that and click on that right there, and you're going to notice it's actually connected to the same symbol we were trading on the other page using this color linker.

Now we see we got Coca-Cola pulled up at the moment and we're looking at a chart here of one year, one day. That means we're looking at one year of trading and each one of these candlesticks represents one day of the trading year. As you mouse over these, you'll notice along the top of the chart is telling me the day, the open, high, low, close, and range for that particular day. Red candles are down days and green candles are up days.

Also, on the chart, you see we put a bubble near the high, a bubble at the low, and a bubble at the current trading price, right now it's $62.83.

There's also some icons and some lines on this graph. The green icon down here that represents a dividend. If you hover over, it actually tells you the dividend date and the amount. We see a blue and a red dot here; those are the earnings and the conference call. You hover over that, tells you what the earnings results were, and we see a year marking line 2022 to 2023, and a series of red lines here, which represent options expirations.

Now, below the chart you'll see we have our volume and as you move your mouse around, you'll see the volume on that particular day.

Now let's say we actually want to look at a study. We're going to go ahead and add a very simple study here. We're going to come up to this beaker and click on that beaker and this gives you an alphabetized list of all the studies available in thinkorswim. I believe there's over 400 of them.

Now, for this example, we're going to go ahead and use a simple moving average. You're going to want to click in the top bar here, type in simple, and you'll see it searches directly for that. Going to select Simple moving average. Come down to the bottom here, click Add selected and you'll notice now it's been added over here in the studies and strategies.

Now, if you look right here, this number nine represents how many days our simple moving average is set for. We're going to change that. I'm going to have you come over here to the gear wheel and you notice the length is nine. Well, let's change it to 200 days. I'm going to type in 200.

And, actually, let's go ahead and show you how to change the color too while we're at it. Come down and click on this little color box, select Red, and go ahead and click OK. Now we're going to go ahead and click OK again and now we can see our 200-day moving average added to the chart.

Okay now we're looking at a one-year, one-daily chart, but let's say we want to look at a smaller time frame. We're going to come up here to this D. That indicates we're looking at a daily and, when you click there, you're going to see a list of favorites. This indicates we're on the one-year daily chart. These are some favorites that come preset, but you actually can customize your own favorites list, or you can come here and pick a specific time frame that you're looking for.

So, we're going to go ahead and come, click on intraday. Instead of one day, let's say we want to look at five days and rather than one-minute candlesticks, maybe we want to look at five-minute candlesticks. I'm going to come down here and click OK again, and now our chart is showing five-day five-minute candlesticks. You can see also the moving average remained on the chart. So that's how we change time frames and add studies to a chart in thinkorswim.

Now another really cool feature of the thinkorswim charts is the ability to trade directly off the chart. Now what you can do here is hover over price and you notice the price bubble is moving up and down as I move it up and down. Get it close to a price where you'd like to buy, go ahead and right click, and come down here to BUY. Now what it's going to do is it's going to pull up a buy order box and guess what? It put it right as a limit order price directly where I right clicked.

Now, say you weren't being very precise or you didn't want it exactly at $62.19. Well, you can come down here and click on Edit and we can come to the price field and we can go ahead and change it. So, say I want to actually buy it at $62. I'm going to go ahead and click OK, click return, go ahead and click Confirm and Send and Send and now I have a working limit order exactly at $62.

Well, let's say I didn't want to put it at $62. I can actually grab that bubble and move it lower or higher. Let's say I'm going to put it down here close to $61.80, let go, and go ahead and click on Send.

Now, if I want to cancel this order, this little X, one single click and your order is canceled. Now let's actually look at an example from what we had earlier. We had a stop order working on Microsoft and guess what? When I pull it up on this chart, you can see I can actually visually see where my working stop order is. I can cancel it or even adjust it, same way as we were doing with the limit order.

Now one more feature I'd like to show you is the Scan tab, which lets you look for stocks based on specific criteria that you're looking for. Now we'll come up here and go to the Scan tab and we're going to go to the Stock Hacker subtab. Now what you might notice is there's three filters here by default.

Well, we're going to go over here to the right-hand side. We're going to go ahead and remove both of those, two of those, rather and get rid of both of those and now let's say we only really want to look for stocks that are in the S&P 500®. I'm going to come up here to the top, click on Scan in all stocks, we're going to come down to the Public watchlist (R – W) category, come over to the right and select S&P 500.

Now, let's say I only want stocks in the S&P 500 that have a certain volume. So, I'm going to click on this drop down, come to volume. I'm going to click in the minimum field, and let's say I want a million shares minimum volume. I'm going to go ahead and add those zeros here, press enter, come all the way over here to the right-hand side, and go ahead and click on Scan. Now you see in the S&P 500, there's actually 333 stocks that have a million shares or more traded today. That's just a few too many.

So, what I'm going to do is actually add a second filter. We're going to click on Add filter, we're going to come and select Stock again, and now this time I'm going to say I really need to see a certain dividend yield. I'm looking for a specific dividend. So, I'm going to click on this Ask size, scroll down here to Yield, and I'm going to say I'd like to see a minimum of 6%. Go ahead and put that in there, press enter. Click that Scan button one more time and you can see right here, we've eliminated quite a few stocks. We're only down to 18 stocks that are in it in the S&P 500 that have a million shares or more and are paying a 6% dividend yield.

Okay, the last couple features I want to show you is how to adjust the cash value or the total cash in your account here. So, we're going to go up to Monitor and we're going to go back to Activity and Positions. What we're looking for is this button over here on the right that says Adjust account.

Now, let's say rather than starting with a $100,000, like we usually do, we want to start with a different amount. Well, I can click right here on Adjust account and I can set the account cash to a different value. So, let's say I actually wanted to set it to $200,000 to start. I'm going to go ahead and click on that, type in 200,000, press enter, and press Apply, and now my account, my net liquid value is 200 over 200,000. We changed the value.

Now, let's say rather than changing the value, we just want to add cash. Maybe, we don't have enough cash, we used it all to buy stocks. It's like putting a deposit in your account. Well, to do that, we do it a little differently. We right click on one of the stocks down here and you'll see there's a choice that says Adjust cash. If you click on that, maybe we want to deposit $50,000 to our paperMoney account, and click OK, and you'll notice it says Cash adjustment right here. Click OK and it's going to add $50,000 directly to our cash.

Now, last up, let's say we want to reset this entire account. We want to go back to scratch, reset everything. Well, we click on Adjust account again. We go over here to Reset All Balances and Positions and click Apply. Now make sure when you click Apply this is going to reset everything. So, make sure you're ready for that. We're going to click Apply here. Going to go ahead and Confirm that's what we want. It's going to cancel all of our working orders. It's going to position us back to zero for everything in our account and, overnight tonight, this is all going to reset, and tomorrow you'll come back up, and you'll be back to $100,000.

Now, don't forget, paperMoney is a simulation, and it'll vary in some respects to trading in a live account. So, while it's great to practice with, it's not best to rely on it as a gauge of future profitability or potential success of any given trading strategy.

For more great investor education, check out the content on our YouTube channel. And for more in-depth tutorials and walkthroughs of the thinkorswim trading platform, head over to Insights & Education on schwab.com.

On-screen text: [Schwab logo] Own your tomorrow®

Video Transcript

thinkorswim® paperMoney®: Stock Trading Simulator

Narrator: Hello, traders. I'm Jeremy Kuhlman. The stock market can be intimidating, especially for new traders and investors. And that's why Schwab offers thinkorswim® paperMoney®, a free virtual trading platform that lets you practice buying and selling stocks without risking real money. It's also a great way to learn how to use thinkorswim, our award-winning trading platform. Now, in this video, I'm going to show you some of the ins and outs of paperMoney, how it differs from your live account, and also show you some key features I think every stock trader should be familiar with when using thinkorswim.

Now, let's jump in.

Animation: paperMoney on the thinkorswim platform appears with home screen open.

Narrator: Okay, so now that we're logged in on paperMoney here, we're going to come up and look along the top edge of the platform. You will see that we are logged into simulated trading, and we are connected to the internet, and you can look over here that we do have partially delayed data. By default, paperMoney comes with a 20-minute delay. To the right of that, we have our date and time and, to the right of that, we have our account selector.

With paperMoney, you get two different accounts here, two different account types: a margin account and an IRA account that you can test out trading in. I'm going to go ahead and select the margin account and if you look over here on the left-hand side, you have $100,000 in buying power. Both accounts actually come with a $100,000.

As a stock trader, the first thing I'm going to want to do is add stock buying power to our account information field over here on the left. We're going to do that by clicking on this menu icon. We're going to come down to Customize gadget. We're going to go to the left-hand side and type in the word stock and you'll see right there: Stock Buying Power. I'm going to click on that, go down to Add Item, then go ahead and click OK. Now, you see there's another line here down below the cash and sweep vehicle that says Stock Buying Power $200,000, and that's because when we're trading stocks, we actually are given additional leverage of two times the buying power you have for options. So, we definitely want to be able to see this as a stock trader, so we can understand exactly how much leverage and buying power we have.

Okay, next, let's start customizing this platform as a stock trader. So, the first thing we're going to do is work on the left-hand side. We're going to create a watchlist. Every stock trader should have a list of stocks that they're interested in. The way we're going to do that is come down to the lower left-hand corner, we're going to go ahead and click on this gear wheel down here and you notice we have three different gadgets right now. We're going to simplify the left side and get rid of Live News and get rid of Quick Chart and just keep our Watchlist. Now, we're going to go ahead and come down to the bottom of this watchlist, hover over this line until you see a double arrow. I'm going to click and drag that all the way down to the bottom, so we get the maximum amount of real estate. Let's go up here to select watchlist and we'll go down we'll go through some of these public watchlists. You can actually pull up your positions and some things but we're going to go over and go here we're going to pull up the Dow Jones.

You can mouse through some of these public lists and let's go to Public (2 through F) and we're going to go over here and see Dow Jones Industrial Average®. Let's go ahead and add that and you can now see we have the entire Dow Jones over here in the left-hand side.

Okay, so now let's say we want to look at a stock that is not in the Dow Jones. We want to look up a symbol or look up a company name. So, what we're going to do is come up here to the top and go click on the Trade tab. We're going to go to the All Products subtab and you notice up here at the top it asks us to enter a symbol. So, if we know the symbol of the stock we want say, Apple, we're going to go ahead and type in the symbol that's AAPL. I'm going to go ahead and press and enter; that's going to load the stock, load our quote along the top here.

Now, if we don't know the symbol for a stock, how are we going to do that? Well, in this little search box, it's actually a search box as well as a symbol box, we're going to type in Apple and now the platform is going to search with anything with the word Apple in it. You can see there's some other stocks that come up in here, but this is the one we're looking for: Apple. I'm going to go ahead and click right on that.

Now, a really cool thing, and a really helpful thing on this platform that we can do is start to connect areas together. We use that using a colored-linking system, and if you look up here next to the symbol box, we have a red number one. Well, on the left-hand side on our watchlist for the Dow Jones, we have a yellow number two. In order to link these two pages together, we actually want to click on this two and match it to the color that we have on the Trade tab. So, when I click on red here, actually what you're going to notice is that Apple automatically became highlighted and that is actually because that's the one we're looking at in our Trade tab right now. This allows you to simply change symbols by clicking on them: CRM we can pull that over into the Trade tab, AXP. Or even use your up/down arrow keys on your keyboard to mouse down and arrow down through this list of stocks and see them change.

Now let's talk about placing a trade. We're looking at Cisco right now and up along the top of the platform there's a bid ask. Now, one of the most common questions I get is, "Where is the buy sell button on this page?" and you'll notice there isn't one. Well, to create an order on thinkorswim, what we're going to do is use the bid and the ask. If you look right here, we have an ask price of $51.97 and bid price of $51.96. If you hover over the ask price, the platform will pull up a little buy right next to your cursor there and if you hover over the bid, guess what? There's a little sell over there.

So, let's start by creating limit order to buy Cisco. I'm going to go ahead and click on this price and what you'll notice is the bottom of the platform opens up an order ticket.

Animation: Arrow hovers over and clicks on the $51.97 ask price above the option chain and opens the Order Entry Tools section below the option chain.

Narrator: Just so we have the right amount of real estate here, I'm going to go ahead and collapse the left sidebar and let's look what we have down here. So, it tells us it's a stock, it tells us it's a buy, it's for a hundred shares, which is a default, and it's a limit order.

Now, what if we want to change our share quantity? Well, we have these nice plus minus buttons here; when you move those up it actually is going to move your order quantity up by the default amount. So, I'm moving it up 100 at a time. If you want to do an odd lot or some different amount than 100 at a time, you can actually highlight and type in the quantity you want. Say we want 25 shares.

And we can follow that over here on the right and we have a limit order. Now, a limit order is where you put in a price that you want to pay; you only receive this price or better with a limit order. I currently have it in there at $51.98, which is the current ask price of the stock. Now, we could definitely lower that price a little bit if we wanted to, but right now let's just go ahead and send this off to the market and see if we can get a fill, and we'll look at changing the price a little later on. We're actually going to leave this on DAY and we're going to come down over here and click on Confirm and Send.

Now this is a good place to review your trade.

Animation: Order Confirmation Dialog box appears with details of the order.

Narrator: It's the last chance you have before you send it out to the market. So, you see we're buying 25 Cisco at $51.98 limit order and that's going to be just good for the day. Let's go ahead and click on Send and now our order has been sent to the market, and we got a fill.

Okay, now this time let's take a look at buying a stock with a market order. Now we're going to go up and pull a different stock up here. Let's use Microsoft as an example and you'll notice it still pulls up the same page here and we have our bid and ask price. Remember, to buy we're going to go over to the ask price and click on that price right here and that's going to open our order ticket down here at the bottom of the page. It's a stock order again for 100 shares, Microsoft, and, by default, it pulls up a limit order just like it did before.

Now this time we're going to go over here where it says LIMIT, and click on that, and we're going to switch it to MARKET, and what I want you to notice is that the price goes away. With a market order, you don't have any control over the price. Whatever the ask price is at the time the order is received, is what you'll buy. Now, if we click on that and go back to limit, you can see we now have control over the price. We can lower that price to try to get a little bit of a better fill or we could even kind of highlight that price and type in $280 or something like that. But, for the moment, we wanted to use a market order and we're going to go ahead and click on this, switch it back over to MARKET. Going to go ahead and click on Confirm and Send, no price now, and we're going to go ahead and click on Send.

Now after that order filled, how do we monitor the position? How do we see what price we paid? Well, we're going to go up here to the Monitor tab, to the Activity and Positions subtab and you'll notice we see an area here called Today's Trade Activity. We have a working order section. Now none of ours are working, they both filled, and we have a filled order section. You can see we have two fills.

Let's go ahead and open that up and what we can see here is that when we bought Microsoft, our market order filled at $283.90, and the limit order for Cisco, that one filled at $51.91. Now that we've bought these stocks, they are called positions and let's come down here to the Position Statement area. You'll notice we see Cisco, our quantity, our trade price of $51.91, and the mark price of $51.88. That's up $0.0625, now it's $0.07 and, at the moment, we're down about $0.50 on that. It's very important these two numbers here profit and loss open, that's since buying the stock, and profit and loss day. Those are actually the same today because we bought the stock today. Go look at Microsoft in the same way: 100 shares purchased at $283.90, currently at $283.99, and we're making about nine, well, now $7 on that stock.

Okay, now that we own these two stocks, let's talk about closing them out. We're going to go over here first to Cisco and then hover over the symbol here and right click. And when you do that, you're going to get this little field here that says Create closing order. Now, if we look on the right-hand side, we have three different ways to close out.

For this first one, we're going to go ahead and choose a limit order. You see it says "sell 25 Cisco at $51.88 limit." That is the current bid price and we click on that, what the platform will do is take us over to the Trade tab with a sell limit for the same quantity of shares we own, at the current bid price, of $51.89.

Now we want to sell this if the stock goes up to capture profit. So, what we're going to do is, say, maybe it's going to go up to $52. Well, I'm going to go ahead and click in here, type in 52, and that's where we would sell if it reaches that price. Now it might get there today, it might not, it might take a few days. So, we want to make this order good till canceled. That makes the order last beyond today's trading day.

Animation: Arrow hovers and clicks on DAY, then selects GTC from dropdown menu.

Narrator: We'll go ahead and click on that, and we're going to go ahead and click on Confirm and Send, and click on Send.

After you send an order, you definitely want to go check and see if it's working. Let's go back up here to the Monitor tab and you'll see over here on the right-hand side: we're working at $52, the mark price is $51.90.

Now, let's talk about using a stop order. A limit order was there to capture our profit. A stop order is there to protect us against loss. So, for Microsoft, we're going to go ahead and hover over the symbol, same process, right click, go up here to Create closing order and this time we're going to go over here and select with STOP. It's going to take us back to the Trade tab with the same quantity share of a sell stop at $1 below the market by default. Now, that might be too close to the market price.

So, we're going to go ahead and change that. Let's go ahead and say we'll sell out if it reaches $280. Go ahead and press enter after you do that. And same deal as before, we definitely want to make sure that this order lasts longer than one day. Click on that and switch it over to good till canceled. We're going to go ahead and click on Confirm and Send and click on Send.

Go back up to Monitor one more time and check that we have both of these working orders here. You can even see down your Position Statement, we have little "sells" next to the symbols that let us know that we have these orders out there to protect us and to potentially capture profit.

Okay, now one great feature of thinkorswim paperMoney here is that if you ever make a mistake, we have the capability of correcting that. Now what I've done here is I've actually put in a position for Nike. I filled this order, and I did not mean to buy this stock. I didn't mean to buy 125 shares.

Now if we don't want to reset the entire account, what we can do is actually adjust an individual position and the way that's done is you hover over the stock and you go ahead and you right click on it, and you'll see right here it says Adjust position. I'm going to click on that.

Now I accidentally bought 125 shares and so what I want to do is do the opposite quantity in a negative value, so minus 125 and, just for my sake here, I want to do it as if I sold them at the exact same price and so I'm going to come up here and I bought that at $120.99. So, then go ahead and put the same price in there, come down here, click OK, and what you'll notice is I now have zero position in Nike, same trade price profit/loss day and open are both zero. This is a great capability you have in case you mess up you don't want to adjust or reset your entire account; you just want to remove one individual position.

Now in the same way that we just adjusted that position, what if we made a mistake with one of our orders and we actually needed to change the price of our order? Well look up here, I put this in at $52 limit. Maybe I'm feeling like that's a little too tight to the price right now. So, I want to go ahead and change the price of my limit order.

The way I would do it is actually go ahead and right click on that order and you see I have a choice to either cancel it or I can cancel and replace it and actually move that limit price higher to make sure I get the right fill that I'm looking for.

Now, let's say I actually want to change this limit order price. I'm going to go ahead and click on this and instead of $52, I'm actually going to be looking for around $55. I'm going to go ahead and change that price. Remember, press enter. I'm going to go ahead and click on Confirm and Send again and then Send. We're going to come back up here to the Monitor tab, and you'll see that our order is now working at $55 limit order, and we've successfully replaced that $52 limit with a new $55 limit.

Now, next we're going to look at a couple different ways that we can continue to customize this platform as a stock trader. We're going to go back up to the Trade tab. I want you to look over here on the left-hand side. You're going to find this section here that says Trade Grid. Go ahead and expand that, and you'll see we have three little gadgets here.

Now the first thing we're going to do is come up to the menu box on this Trade Grid. I'm going to click on that and go down to Gadget. Now every trader should be looking at the news. So, we're going to go over here and select Live News. Now the next step here is to click on this little chain link, select Red and, guess what? It's going to fill in with Cisco. These two areas are now connected.

Now if you remember before, when we're talking about buy sell button, well guess what? We actually do have one in here after all. I'm going to click on the same menu button, come down to Gadget, and then go over and select Dashboard. Last step, we're going to go ahead and link this up to red and now we have a buy and a sell button for the same stock that we're looking at up above.

This is also a great spot where you can change the default quantity of the orders you're going to trade. When you click on this, say you want to trade 10 shares at a time, or just go ahead and type in 10. And now guess what? Every time I click on this buy order, we're going to go ahead and get a 10-share stock order down at the bottom.

Now the last gadget we're going to look at is one that's a little bit more advanced. I'm going to go ahead and click on this menu button, go over here and select Level II. Last step, click on link and link it up to red. So, now we can see all this nice Level II data for Cisco, so the bid, ask, and size and so forth.

Now, remember we linked all of these up to red. So, I'm going to follow this all the way over to the left-hand side and bring our left sidebar back. And notice what happens when I click on any symbol in the Dow Jones; all of these gadgets change to the same symbol. I can arrow down through them again and create buys for a single stock very quickly. Select a stock from here, click buy, look at the Level II, and look at the news, all with one single click.

Now the next feature I'd like to show you is the Charts tab. Let's go ahead and mouse up to that and click on that right there, and you're going to notice it's actually connected to the same symbol we were trading on the other page using this color linker.

Now we see we got Coca-Cola pulled up at the moment and we're looking at a chart here of one year, one day. That means we're looking at one year of trading and each one of these candlesticks represents one day of the trading year. As you mouse over these, you'll notice along the top of the chart is telling me the day, the open, high, low, close, and range for that particular day. Red candles are down days and green candles are up days.

Also, on the chart, you see we put a bubble near the high, a bubble at the low, and a bubble at the current trading price, right now it's $62.83.

There's also some icons and some lines on this graph. The green icon down here that represents a dividend. If you hover over, it actually tells you the dividend date and the amount. We see a blue and a red dot here; those are the earnings and the conference call. You hover over that, tells you what the earnings results were, and we see a year marking line 2022 to 2023, and a series of red lines here, which represent options expirations.

Now, below the chart you'll see we have our volume and as you move your mouse around, you'll see the volume on that particular day.

Now let's say we actually want to look at a study. We're going to go ahead and add a very simple study here. We're going to come up to this beaker and click on that beaker and this gives you an alphabetized list of all the studies available in thinkorswim. I believe there's over 400 of them.

Now, for this example, we're going to go ahead and use a simple moving average. You're going to want to click in the top bar here, type in simple, and you'll see it searches directly for that. Going to select Simple moving average. Come down to the bottom here, click Add selected and you'll notice now it's been added over here in the studies and strategies.

Now, if you look right here, this number nine represents how many days our simple moving average is set for. We're going to change that. I'm going to have you come over here to the gear wheel and you notice the length is nine. Well, let's change it to 200 days. I'm going to type in 200.

And, actually, let's go ahead and show you how to change the color too while we're at it. Come down and click on this little color box, select Red, and go ahead and click OK. Now we're going to go ahead and click OK again and now we can see our 200-day moving average added to the chart.

Okay now we're looking at a one-year, one-daily chart, but let's say we want to look at a smaller time frame. We're going to come up here to this D. That indicates we're looking at a daily and, when you click there, you're going to see a list of favorites. This indicates we're on the one-year daily chart. These are some favorites that come preset, but you actually can customize your own favorites list, or you can come here and pick a specific time frame that you're looking for.

So, we're going to go ahead and come, click on intraday. Instead of one day, let's say we want to look at five days and rather than one-minute candlesticks, maybe we want to look at five-minute candlesticks. I'm going to come down here and click OK again, and now our chart is showing five-day five-minute candlesticks. You can see also the moving average remained on the chart. So that's how we change time frames and add studies to a chart in thinkorswim.

Now another really cool feature of the thinkorswim charts is the ability to trade directly off the chart. Now what you can do here is hover over price and you notice the price bubble is moving up and down as I move it up and down. Get it close to a price where you'd like to buy, go ahead and right click, and come down here to BUY. Now what it's going to do is it's going to pull up a buy order box and guess what? It put it right as a limit order price directly where I right clicked.

Now, say you weren't being very precise or you didn't want it exactly at $62.19. Well, you can come down here and click on Edit and we can come to the price field and we can go ahead and change it. So, say I want to actually buy it at $62. I'm going to go ahead and click OK, click return, go ahead and click Confirm and Send and Send and now I have a working limit order exactly at $62.

Well, let's say I didn't want to put it at $62. I can actually grab that bubble and move it lower or higher. Let's say I'm going to put it down here close to $61.80, let go, and go ahead and click on Send.

Now, if I want to cancel this order, this little X, one single click and your order is canceled. Now let's actually look at an example from what we had earlier. We had a stop order working on Microsoft and guess what? When I pull it up on this chart, you can see I can actually visually see where my working stop order is. I can cancel it or even adjust it, same way as we were doing with the limit order.

Now one more feature I'd like to show you is the Scan tab, which lets you look for stocks based on specific criteria that you're looking for. Now we'll come up here and go to the Scan tab and we're going to go to the Stock Hacker subtab. Now what you might notice is there's three filters here by default.

Well, we're going to go over here to the right-hand side. We're going to go ahead and remove both of those, two of those, rather and get rid of both of those and now let's say we only really want to look for stocks that are in the S&P 500®. I'm going to come up here to the top, click on Scan in all stocks, we're going to come down to the Public watchlist (R – W) category, come over to the right and select S&P 500.

Now, let's say I only want stocks in the S&P 500 that have a certain volume. So, I'm going to click on this drop down, come to volume. I'm going to click in the minimum field, and let's say I want a million shares minimum volume. I'm going to go ahead and add those zeros here, press enter, come all the way over here to the right-hand side, and go ahead and click on Scan. Now you see in the S&P 500, there's actually 333 stocks that have a million shares or more traded today. That's just a few too many.

So, what I'm going to do is actually add a second filter. We're going to click on Add filter, we're going to come and select Stock again, and now this time I'm going to say I really need to see a certain dividend yield. I'm looking for a specific dividend. So, I'm going to click on this Ask size, scroll down here to Yield, and I'm going to say I'd like to see a minimum of 6%. Go ahead and put that in there, press enter. Click that Scan button one more time and you can see right here, we've eliminated quite a few stocks. We're only down to 18 stocks that are in it in the S&P 500 that have a million shares or more and are paying a 6% dividend yield.

Okay, the last couple features I want to show you is how to adjust the cash value or the total cash in your account here. So, we're going to go up to Monitor and we're going to go back to Activity and Positions. What we're looking for is this button over here on the right that says Adjust account.

Now, let's say rather than starting with a $100,000, like we usually do, we want to start with a different amount. Well, I can click right here on Adjust account and I can set the account cash to a different value. So, let's say I actually wanted to set it to $200,000 to start. I'm going to go ahead and click on that, type in 200,000, press enter, and press Apply, and now my account, my net liquid value is 200 over 200,000. We changed the value.

Now, let's say rather than changing the value, we just want to add cash. Maybe, we don't have enough cash, we used it all to buy stocks. It's like putting a deposit in your account. Well, to do that, we do it a little differently. We right click on one of the stocks down here and you'll see there's a choice that says Adjust cash. If you click on that, maybe we want to deposit $50,000 to our paperMoney account, and click OK, and you'll notice it says Cash adjustment right here. Click OK and it's going to add $50,000 directly to our cash.

Now, last up, let's say we want to reset this entire account. We want to go back to scratch, reset everything. Well, we click on Adjust account again. We go over here to Reset All Balances and Positions and click Apply. Now make sure when you click Apply this is going to reset everything. So, make sure you're ready for that. We're going to click Apply here. Going to go ahead and Confirm that's what we want. It's going to cancel all of our working orders. It's going to position us back to zero for everything in our account and, overnight tonight, this is all going to reset, and tomorrow you'll come back up, and you'll be back to $100,000.

Now, don't forget, paperMoney is a simulation, and it'll vary in some respects to trading in a live account. So, while it's great to practice with, it's not best to rely on it as a gauge of future profitability or potential success of any given trading strategy.

For more great investor education, check out the content on our YouTube channel. And for more in-depth tutorials and walkthroughs of the thinkorswim trading platform, head over to Insights & Education on schwab.com.

On-screen text: [Schwab logo] Own your tomorrow®

Narrator: Hello, traders. I'm Jeremy Kuhlman. Now in this video, I'm going to show you how to practice trading options using thinkorswim® paperMoney®, a virtual trading simulation platform that lets you practice trading without risking real money. And it's also a great way to learn how to use thinkorswim.

Once we're logged in, I'm going to show you some key functionality that options traders should be familiar with. We'll start out with an option chain, and then I'll show you how to buy a single option as well as how to enter a spread trade. And finally, I'll show you how to analyze a position's risk and reward using the Risk Profile on the Analyze tab.

So, let's jump in and get started.

Animation: thinkorswim home page appears.

Narrator: Now each account does start with $100,000 and today we've selected the margin account, but you could certainly select the IRA if that's the type of account you want to test out.

We're going to go ahead and jump in and look at some options trading techniques in this platform. Come up here to the Trade tab, and I'm going to go here to the All Products subtab. And you notice the symbol box here is asking us to enter a symbol. I'm going to click in there, go ahead and type in Microsoft, MSFT, for this example, press enter on your keyboard and that's going to pull up our option chain.

Now just to give ourselves a little more real estate here, we're going to go ahead and minimize the left sidebar. And now you can see along the top here we have the price of Microsoft, last trade $283.96, down $3.22. There's our current bid and ask. Below the stock there, we're going to see our option chain. And you can notice here some of these options are yellow and some of them are white.

Well, the yellow options are weekly options or nonstandard expirations. And the white options are your standard end-of-the-month options. Looking from the left to right here, you can see we got the 21st of April of 2023. That is 16 trading days left and you see actually as I hover over that, it tells you days until last trading day. And this contract is for 100 shares. That's a standard option contract. If you ever see something different here, it means it's been adjusted in some way.

Now to open the option chain, we're going to go over here to the left-hand side, click on that little arrow next to the date and we're going to look at this option. In the center here, you'll notice we're actually only showing four strikes. That's the default setting here in thinkorswim. If we want to see more strikes than four, we can click there and go down through some preset quantities or we actually can kind of select any quantity we'd like by deleting that number there and typing in a different number.

I'm going to go ahead and type in 25, just as an example. You press enter after you do that and now you can see our option chain is showing 25 strike prices.

Now the left-hand side of your option chain here is the calls and the right-hand side is the put options. And, over on the left-hand side and the right-hand side, you can kind of see there's this highlighted purple area. Well, those are your in-the-money options. As we mouse down over here to the black area, we'll see those are the out-of-the-money options. So, these are your out-the-money calls.

Now placing a trade is actually quite simple in this platform. What we want to do is pick our strike price and, for this example, we'll just buy a call option. Microsoft's down a bit, $283.95 now. So, let's say we want to go ahead and buy the 285 call. What I'm going to do is mouse over the ask price. You see it's $5.55 right now and I'm just going to do a single left click on that price. That'll open our Order Entry Tools down at the bottom of the platform. And you can see we've got a long green buy order. You see here, it says buy SINGLE option. By default, there's a 10-contract quantity and we have a date and a strike price. Again, it's a call.

Now 10 contracts might be a little bit large so, maybe we want to adjust the default. Very simple way to do that, we're just going to go ahead and delete this order temporarily. Come up here to the upper right-hand corner of the platform and we're going to find this little gear wheel and we're going to go ahead and select Application Settings. Now we're going to come up here to order defaults and go ahead and select options. Now if you notice on the right, the default quantity orders right now is 10. I'm just going to go ahead and change that over to one. Come down to the lower right-hand corner and click Apply settings. I'm going to come back to that exact same call I was trading before and click on that and guess what? This time it's one contract over there.

Now, let's follow this over to the right, 285 call. By default, we pull up a limit order for you and we actually fluctuate that limit order with the ask price. You can see it's actually ticking along here at the bottom. Now, if we wanted to put in a lower price than the current ask price, we can actually click in this field. You can highlight the numbers and type in a price, like $5, enter, or you can actually use the plus minus here to adjust your price. Let's go ahead and try to send this order as a limit order below the market at $5.

We're going to keep it as a DAY order, but if you did want this order to last for longer than the trading day, you can click on that and switch it over to be good 'til canceled. Come down to the lower right-hand corner, find the Confirm and Send button, and then review our order one more time before we send it out. Just to make sure we did everything right, we can see we're buying one Microsoft April 23, 285 call at $5 limit order. I'm going to go ahead and click on Send there. And now to check the status of our working order, we're actually going to want to move right up here to the Monitor tab. And guess what the Activity and Positions page now populated and we're going to see we got a working order here. It is working at $5, the market price is $5.47. So, unfortunately, we're not going to get filled on this and, maybe later in the day, we would.

So, let's say we actually want to change the price and go ahead and get a fill. So, what we're going to want to do is right click on the order and you can actually cancel it here or you can cancel and replace it. This is how you can edit the order.

So, for this, I'm going to go ahead and click on Cancel/replace and that's going to pull up a new order. You can see it's actually replacing the other one, adds a new order ID, same quantity, everything is the same, but we're going to go ahead and pull the price back to the market price and that's done by using this little lock here. When that lock is locked, your price is going to stay the way you want it. If you want the price to fluctuate with the market, we're going to toggle that open and you can see it moved me right back to the current market price. This time I'm going to go ahead and click on Confirm and Send. Now that we replaced that order, let's go up here back up to the Monitor tab and we'll notice that we actually have no more working orders and we have a filled order.

Let's go ahead and open up that Filled Order section. You can see that we did buy that option: 285 call and we paid $5.25. If we mouse down over here, you can see that we also have a canceled order. That was our one working there for $5.

So now that we bought that option, let's go ahead and see how we can monitor the position. We're going to go down to the Position Statement. We're going to come over here to Microsoft and we're going to want to open up this section here so we can see our option. You can see we bought the 285 call. We bought one of 'em, we paid $5.25, and the current mark is $5.32. So that is giving us a little profit both for the open since we bought it and for the day of $5.

Next, I'm going to show you a little bit more of an advanced type of options order called a vertical spread. In order to do that, we're going to go back up here to the Trade tab and we'll use a different symbol. We'll just go ahead and use Apple. Go ahead and press enter there and we're going to come back down to our option chain. Let's close up this expiration.

Let's do this in a later expiration. We'll go out here to 19th of May. Now I'm going to want to scroll down. Now again, I'm going to start with the option I want to buy and a mouse over the 160 call. And I'm going to go ahead and right click on that option this time. When I right click, you can see it brings up this menu here. You notice we got a BUY and a SELL. We're going to do a BUY spread here today. We're looking over here and look on the right. You can see there's various types of options spreads available to you.

Again, like I said, we're going to go ahead and use the Vertical spread today. Going to go ahead and click on that there. And now you notice we actually have two lines instead of one, like before. It tells what type of spread we're doing here, a vertical. It shows one line for buy, one line for sell, tells us we have the Apple option, 19th May, 160–165 call spread and now it pulled up 160 and 165 because, by default, thinkorswim pulls up the next strike out of the money when we create a debit spread like this. If, for some reason, we wanted to widen out the spread, you actually can click on the lower option here, 165, change it up to 170. And what you might notice here is that our debit price changed directly with that. The platform is calculating this debit based on buying the 160 and selling the 170 automatically creating that.

If we look down below here, you can see we are currently on the mid-price and if you want to see the natural price, the bid/ask price of this spread, you can go over here and look at its $5.15. This is a limit order. We're going to keep it good for the day because we're going to try to get a fill here. I'm going to go ahead and click on Confirm and Send, review this order. You can see we got our vertical spread here, 160–170 call and we got our break-even, maximum profit, maximum loss listed as well, just in case you want to check that out. Going to go ahead and click on Send and wait for our fill. And there you go, you can see the order just filled.

Now let's go back up here to the Monitor tab, click on that and you can see we actually got our fill here. You can see each individual legs fill price and the total debit of $5.10.

Now I'm going to show you how to close out this position. So, we paid $5.10, we're going to come down again, find Apple in our position statement. Go ahead and open that up and you'll see we have the 160 call and the 170 call here. Now to close out this spread, what you're going to want to do is drag your mouse over both strikes and you can actually then right click and we're going to go up here to Create closing order. Now if you notice there's three different ways that the platform is suggesting we close this out. You can see the first one is to sell it as a vertical. The second one here would be to buy back the single, the 170 call, or sell the long 160 call.

Now for this example, we want to just use selling the vertical spread. I'm going to go ahead and click on that there. And you can see it actually takes us back over here to the Trade tab with the exact opposite trade to close out our spread. Now let's say we want to get a little bit of a profit on this possibly. So, we're going to go up here and click and change our credit price that we want to receive to sell this option to $7. We're going to go ahead and press enter. And you notice as you set that in. Now it might take some time for it to reach $7. So, we want to make sure this order's going to be good 'til canceled, which means that's going to continue to work until it fills or we cancel it. Now go ahead and get click on Confirm and Send.

And then you'll notice here we can review the order one more time just in case we want. We'll click on Send, and I always like to just double check that that order is still working by going back up here to the Monitor tab. And you can see we are working for a $7 credit. Mark price is $5.25.

Okay, next is an area of the platform that I think every option trader should know how to use: the Analyze tab, the Risk Profile. We're going to go up here to the Analyze tab at the top platform, select Risk Profile. And what we're going to want to do here is enter a symbol, and we'll use the same symbol of what we just did that spread for.

So I'm going to go ahead and type in Apple. Press enter, and you'll notice it pulls up this graph here of two different colored lines. We have a pink line and a blue line. What this is showing us is the risk of the spread, we just placed.

The pink line is actually representing profit or loss. And so is the blue line, these are just profit and loss on two different days. If I mouse over the middle here, this is the current price of Apple. You can see in the lower left-hand corner, the pink line represents for 4/5/23, and the blue line represents our expiration date of 5/20/23. Now, at the moment, we're not making really profit or loss on this, but if the stock stayed exactly where it was at expiration, we'd be losing $251.26.

Now this was a bull vertical spread we placed, that means we want the stock to go up. If it goes up and actually crosses over this point right here, which is our break-even—that's the strike price plus the premium that we paid—and continues past that all the way up here to the top, where it plateaus, you'll see our maximum profit and in the lower left-hand corner is $490.

Now if the stock moves against us here, goes down, down, down, crosses break even again, and continues down all the way to the bottom plateau. You'll see we're at our maximum loss of $510. Now notice that there's three dotted lines here in the middle. This line here is the current price. We have a lower end here which is 10% decrease in the stock price. And this upper end and that's 10% increase. Now the reason I know that is I actually come down here to this Price Slice section, and you'll see we have three lines here that also correspond with these three dotted lines.

Now one thing I always like to show is how to check our probability of profit on a spread. This break-even point, we need the stock to be above that to breakeven. The platform has a really neat little tool here where we can follow this over to the right-hand side and find our menu button. Click on that, and we're going to go ahead and go to Set slices. Going to go over here to break-even, mouse over, and select the expiration date. That's the one that's most important to us today, not just today. When I click on that, you see our three lines disappear and we now have one line directly across our break-even price. Now on each side of this line, we have a percentage, 41.63, you might change a little bit and 58.29. This means that we have a 41, basically 41.5% chance of making a profit, a penny or more on this spread, and a 58% chance of losing a penny or more. Very, very powerful tool to help you understand your risk, risk-to-reward, probability, on a vertical spread.

Next, I am going to show you another really cool feature of thinkorswim around options trading. We're actually going to navigate back up here to the Trade tab, back to the All Products subtab. And just for the purpose of this, we're going to go ahead and minimize this option chain. And we're going to locate down here where it says, Today's Options Statistics. Go ahead and expand that.

Now what the platform does here is gather data about all the options that are being traded today. You can see we have call volume and put volume. We have what prices calls and puts are being traded at, whether they're trading at the bid, or lower, or at the ask or above or maybe they're being traded between the market. We have extensive information over here about volatility: 52-week high IV, 52-week IV low, IV percentiles, even a VWAP. Follow that over to the right-hand side, you can also see we have information about how unusual these options are trading. This is called the Sizzle Index.

Really, really valuable information, a wealth of information about the options being traded today, all at your fingertips.

Now lastly, another really cool feature of paperMoney is we have the ability to adjust the position. So, let's say we made a mistake, when we're placing a trade or we no longer want that option in this account. We're actually going to go back up here to the Monitor tab. Then scroll down here to our positions. Let's say we made a mistake here. We bought this Microsoft call and we messed up. We don't want it in our account anymore. Well, we can go ahead and right click on that. And you'll notice there is a little section here that says Adjust position. If I click on that, what it's going to do is pull up this area where I can actually change this quantity.

Now we bought this call option. So, how do we get rid of something that we own. We want to do a negative quantity that will offset that. Now when we bought this, we paid, where is it, $5.25. It actually came up right here. So you're going to want to put in the exact opposite, the exact same price you paid for when you sell this. And I'm going to go ahead and press enter, and you'll notice here I can click OK. And guess what, that is gone. Now it does take overnight for this position to reset. So tomorrow when you pull this up that Microsoft position will go away completely.

Now, another thing we can do with paperMoney is make adjustments to the account. If you look over here on the right-hand side, we have this Adjust Account button. When you click on that, we have several different choices. We can actually reset everything, click that box and click Apply. That resets you all back to the $100,000 account values gets rid of all the positions. Again, does take overnight to reset completely, but all these will go away.

Now another thing we can do here is actually change the amount of money we're starting with. Now, if you remember, both of these accounts started with $100,000. Well let's say we want to start with a smaller amount than that. You can actually click on this drop down, you can see we have some default choices: $25,000, $50,000 increments, but maybe we just want to pick an arbitrary number $10,000. Well, what we're going to do is we're going to highlight this number right here. We're going to type in 10,000. We're going to press enter. I'm going to go ahead and click Apply. And guess what, when we look up here at the top, we have $10,000 in this account now.

Now remember, paperMoney is just a simulation and it will vary in many respects to trading in your live account. Specifically, for options traders, remember, as the bid-ask spread widens, your paperMoney platform will probably give you a fill somewhere in the middle of the market. So, if you're backtesting or trying to test a potential strategy, remember you're getting more favorable fills in paperMoney, and those numbers should never be relied on as future success of that strategy. So always keep that in mind. Now, also the paperMoney platform will not assign a short option position early, and that's also different from trading in a real account.

If you're looking for more great investor education checkout Insights & Education on schwab.com, and don't forget check out all of our great content on our YouTube channel.

On-screen text: [Schwab logo] Own your tomorrow®

Video Transcript

thinkorswim® paperMoney® Simulated Options Trading

Narrator: Hello, traders. I'm Jeremy Kuhlman. Now in this video, I'm going to show you how to practice trading options using thinkorswim® paperMoney®, a virtual trading simulation platform that lets you practice trading without risking real money. And it's also a great way to learn how to use thinkorswim.

Once we're logged in, I'm going to show you some key functionality that options traders should be familiar with. We'll start out with an option chain, and then I'll show you how to buy a single option as well as how to enter a spread trade. And finally, I'll show you how to analyze a position's risk and reward using the Risk Profile on the Analyze tab.

So, let's jump in and get started.

Animation: thinkorswim home page appears.

Narrator: Now each account does start with $100,000 and today we've selected the margin account, but you could certainly select the IRA if that's the type of account you want to test out.

We're going to go ahead and jump in and look at some options trading techniques in this platform. Come up here to the Trade tab, and I'm going to go here to the All Products subtab. And you notice the symbol box here is asking us to enter a symbol. I'm going to click in there, go ahead and type in Microsoft, MSFT, for this example, press enter on your keyboard and that's going to pull up our option chain.

Now just to give ourselves a little more real estate here, we're going to go ahead and minimize the left sidebar. And now you can see along the top here we have the price of Microsoft, last trade $283.96, down $3.22. There's our current bid and ask. Below the stock there, we're going to see our option chain. And you can notice here some of these options are yellow and some of them are white.

Well, the yellow options are weekly options or nonstandard expirations. And the white options are your standard end-of-the-month options. Looking from the left to right here, you can see we got the 21st of April of 2023. That is 16 trading days left and you see actually as I hover over that, it tells you days until last trading day. And this contract is for 100 shares. That's a standard option contract. If you ever see something different here, it means it's been adjusted in some way.

Now to open the option chain, we're going to go over here to the left-hand side, click on that little arrow next to the date and we're going to look at this option. In the center here, you'll notice we're actually only showing four strikes. That's the default setting here in thinkorswim. If we want to see more strikes than four, we can click there and go down through some preset quantities or we actually can kind of select any quantity we'd like by deleting that number there and typing in a different number.

I'm going to go ahead and type in 25, just as an example. You press enter after you do that and now you can see our option chain is showing 25 strike prices.

Now the left-hand side of your option chain here is the calls and the right-hand side is the put options. And, over on the left-hand side and the right-hand side, you can kind of see there's this highlighted purple area. Well, those are your in-the-money options. As we mouse down over here to the black area, we'll see those are the out-of-the-money options. So, these are your out-the-money calls.

Now placing a trade is actually quite simple in this platform. What we want to do is pick our strike price and, for this example, we'll just buy a call option. Microsoft's down a bit, $283.95 now. So, let's say we want to go ahead and buy the 285 call. What I'm going to do is mouse over the ask price. You see it's $5.55 right now and I'm just going to do a single left click on that price. That'll open our Order Entry Tools down at the bottom of the platform. And you can see we've got a long green buy order. You see here, it says buy SINGLE option. By default, there's a 10-contract quantity and we have a date and a strike price. Again, it's a call.

Now 10 contracts might be a little bit large so, maybe we want to adjust the default. Very simple way to do that, we're just going to go ahead and delete this order temporarily. Come up here to the upper right-hand corner of the platform and we're going to find this little gear wheel and we're going to go ahead and select Application Settings. Now we're going to come up here to order defaults and go ahead and select options. Now if you notice on the right, the default quantity orders right now is 10. I'm just going to go ahead and change that over to one. Come down to the lower right-hand corner and click Apply settings. I'm going to come back to that exact same call I was trading before and click on that and guess what? This time it's one contract over there.

Now, let's follow this over to the right, 285 call. By default, we pull up a limit order for you and we actually fluctuate that limit order with the ask price. You can see it's actually ticking along here at the bottom. Now, if we wanted to put in a lower price than the current ask price, we can actually click in this field. You can highlight the numbers and type in a price, like $5, enter, or you can actually use the plus minus here to adjust your price. Let's go ahead and try to send this order as a limit order below the market at $5.

We're going to keep it as a DAY order, but if you did want this order to last for longer than the trading day, you can click on that and switch it over to be good 'til canceled. Come down to the lower right-hand corner, find the Confirm and Send button, and then review our order one more time before we send it out. Just to make sure we did everything right, we can see we're buying one Microsoft April 23, 285 call at $5 limit order. I'm going to go ahead and click on Send there. And now to check the status of our working order, we're actually going to want to move right up here to the Monitor tab. And guess what the Activity and Positions page now populated and we're going to see we got a working order here. It is working at $5, the market price is $5.47. So, unfortunately, we're not going to get filled on this and, maybe later in the day, we would.

So, let's say we actually want to change the price and go ahead and get a fill. So, what we're going to want to do is right click on the order and you can actually cancel it here or you can cancel and replace it. This is how you can edit the order.

So, for this, I'm going to go ahead and click on Cancel/replace and that's going to pull up a new order. You can see it's actually replacing the other one, adds a new order ID, same quantity, everything is the same, but we're going to go ahead and pull the price back to the market price and that's done by using this little lock here. When that lock is locked, your price is going to stay the way you want it. If you want the price to fluctuate with the market, we're going to toggle that open and you can see it moved me right back to the current market price. This time I'm going to go ahead and click on Confirm and Send. Now that we replaced that order, let's go up here back up to the Monitor tab and we'll notice that we actually have no more working orders and we have a filled order.

Let's go ahead and open up that Filled Order section. You can see that we did buy that option: 285 call and we paid $5.25. If we mouse down over here, you can see that we also have a canceled order. That was our one working there for $5.

So now that we bought that option, let's go ahead and see how we can monitor the position. We're going to go down to the Position Statement. We're going to come over here to Microsoft and we're going to want to open up this section here so we can see our option. You can see we bought the 285 call. We bought one of 'em, we paid $5.25, and the current mark is $5.32. So that is giving us a little profit both for the open since we bought it and for the day of $5.

Next, I'm going to show you a little bit more of an advanced type of options order called a vertical spread. In order to do that, we're going to go back up here to the Trade tab and we'll use a different symbol. We'll just go ahead and use Apple. Go ahead and press enter there and we're going to come back down to our option chain. Let's close up this expiration.

Let's do this in a later expiration. We'll go out here to 19th of May. Now I'm going to want to scroll down. Now again, I'm going to start with the option I want to buy and a mouse over the 160 call. And I'm going to go ahead and right click on that option this time. When I right click, you can see it brings up this menu here. You notice we got a BUY and a SELL. We're going to do a BUY spread here today. We're looking over here and look on the right. You can see there's various types of options spreads available to you.

Again, like I said, we're going to go ahead and use the Vertical spread today. Going to go ahead and click on that there. And now you notice we actually have two lines instead of one, like before. It tells what type of spread we're doing here, a vertical. It shows one line for buy, one line for sell, tells us we have the Apple option, 19th May, 160–165 call spread and now it pulled up 160 and 165 because, by default, thinkorswim pulls up the next strike out of the money when we create a debit spread like this. If, for some reason, we wanted to widen out the spread, you actually can click on the lower option here, 165, change it up to 170. And what you might notice here is that our debit price changed directly with that. The platform is calculating this debit based on buying the 160 and selling the 170 automatically creating that.

If we look down below here, you can see we are currently on the mid-price and if you want to see the natural price, the bid/ask price of this spread, you can go over here and look at its $5.15. This is a limit order. We're going to keep it good for the day because we're going to try to get a fill here. I'm going to go ahead and click on Confirm and Send, review this order. You can see we got our vertical spread here, 160–170 call and we got our break-even, maximum profit, maximum loss listed as well, just in case you want to check that out. Going to go ahead and click on Send and wait for our fill. And there you go, you can see the order just filled.

Now let's go back up here to the Monitor tab, click on that and you can see we actually got our fill here. You can see each individual legs fill price and the total debit of $5.10.

Now I'm going to show you how to close out this position. So, we paid $5.10, we're going to come down again, find Apple in our position statement. Go ahead and open that up and you'll see we have the 160 call and the 170 call here. Now to close out this spread, what you're going to want to do is drag your mouse over both strikes and you can actually then right click and we're going to go up here to Create closing order. Now if you notice there's three different ways that the platform is suggesting we close this out. You can see the first one is to sell it as a vertical. The second one here would be to buy back the single, the 170 call, or sell the long 160 call.

Now for this example, we want to just use selling the vertical spread. I'm going to go ahead and click on that there. And you can see it actually takes us back over here to the Trade tab with the exact opposite trade to close out our spread. Now let's say we want to get a little bit of a profit on this possibly. So, we're going to go up here and click and change our credit price that we want to receive to sell this option to $7. We're going to go ahead and press enter. And you notice as you set that in. Now it might take some time for it to reach $7. So, we want to make sure this order's going to be good 'til canceled, which means that's going to continue to work until it fills or we cancel it. Now go ahead and get click on Confirm and Send.

And then you'll notice here we can review the order one more time just in case we want. We'll click on Send, and I always like to just double check that that order is still working by going back up here to the Monitor tab. And you can see we are working for a $7 credit. Mark price is $5.25.

Okay, next is an area of the platform that I think every option trader should know how to use: the Analyze tab, the Risk Profile. We're going to go up here to the Analyze tab at the top platform, select Risk Profile. And what we're going to want to do here is enter a symbol, and we'll use the same symbol of what we just did that spread for.

So I'm going to go ahead and type in Apple. Press enter, and you'll notice it pulls up this graph here of two different colored lines. We have a pink line and a blue line. What this is showing us is the risk of the spread, we just placed.

The pink line is actually representing profit or loss. And so is the blue line, these are just profit and loss on two different days. If I mouse over the middle here, this is the current price of Apple. You can see in the lower left-hand corner, the pink line represents for 4/5/23, and the blue line represents our expiration date of 5/20/23. Now, at the moment, we're not making really profit or loss on this, but if the stock stayed exactly where it was at expiration, we'd be losing $251.26.

Now this was a bull vertical spread we placed, that means we want the stock to go up. If it goes up and actually crosses over this point right here, which is our break-even—that's the strike price plus the premium that we paid—and continues past that all the way up here to the top, where it plateaus, you'll see our maximum profit and in the lower left-hand corner is $490.

Now if the stock moves against us here, goes down, down, down, crosses break even again, and continues down all the way to the bottom plateau. You'll see we're at our maximum loss of $510. Now notice that there's three dotted lines here in the middle. This line here is the current price. We have a lower end here which is 10% decrease in the stock price. And this upper end and that's 10% increase. Now the reason I know that is I actually come down here to this Price Slice section, and you'll see we have three lines here that also correspond with these three dotted lines.

Now one thing I always like to show is how to check our probability of profit on a spread. This break-even point, we need the stock to be above that to breakeven. The platform has a really neat little tool here where we can follow this over to the right-hand side and find our menu button. Click on that, and we're going to go ahead and go to Set slices. Going to go over here to break-even, mouse over, and select the expiration date. That's the one that's most important to us today, not just today. When I click on that, you see our three lines disappear and we now have one line directly across our break-even price. Now on each side of this line, we have a percentage, 41.63, you might change a little bit and 58.29. This means that we have a 41, basically 41.5% chance of making a profit, a penny or more on this spread, and a 58% chance of losing a penny or more. Very, very powerful tool to help you understand your risk, risk-to-reward, probability, on a vertical spread.

Next, I am going to show you another really cool feature of thinkorswim around options trading. We're actually going to navigate back up here to the Trade tab, back to the All Products subtab. And just for the purpose of this, we're going to go ahead and minimize this option chain. And we're going to locate down here where it says, Today's Options Statistics. Go ahead and expand that.

Now what the platform does here is gather data about all the options that are being traded today. You can see we have call volume and put volume. We have what prices calls and puts are being traded at, whether they're trading at the bid, or lower, or at the ask or above or maybe they're being traded between the market. We have extensive information over here about volatility: 52-week high IV, 52-week IV low, IV percentiles, even a VWAP. Follow that over to the right-hand side, you can also see we have information about how unusual these options are trading. This is called the Sizzle Index.

Really, really valuable information, a wealth of information about the options being traded today, all at your fingertips.

Now lastly, another really cool feature of paperMoney is we have the ability to adjust the position. So, let's say we made a mistake, when we're placing a trade or we no longer want that option in this account. We're actually going to go back up here to the Monitor tab. Then scroll down here to our positions. Let's say we made a mistake here. We bought this Microsoft call and we messed up. We don't want it in our account anymore. Well, we can go ahead and right click on that. And you'll notice there is a little section here that says Adjust position. If I click on that, what it's going to do is pull up this area where I can actually change this quantity.

Now we bought this call option. So, how do we get rid of something that we own. We want to do a negative quantity that will offset that. Now when we bought this, we paid, where is it, $5.25. It actually came up right here. So you're going to want to put in the exact opposite, the exact same price you paid for when you sell this. And I'm going to go ahead and press enter, and you'll notice here I can click OK. And guess what, that is gone. Now it does take overnight for this position to reset. So tomorrow when you pull this up that Microsoft position will go away completely.

Now, another thing we can do with paperMoney is make adjustments to the account. If you look over here on the right-hand side, we have this Adjust Account button. When you click on that, we have several different choices. We can actually reset everything, click that box and click Apply. That resets you all back to the $100,000 account values gets rid of all the positions. Again, does take overnight to reset completely, but all these will go away.

Now another thing we can do here is actually change the amount of money we're starting with. Now, if you remember, both of these accounts started with $100,000. Well let's say we want to start with a smaller amount than that. You can actually click on this drop down, you can see we have some default choices: $25,000, $50,000 increments, but maybe we just want to pick an arbitrary number $10,000. Well, what we're going to do is we're going to highlight this number right here. We're going to type in 10,000. We're going to press enter. I'm going to go ahead and click Apply. And guess what, when we look up here at the top, we have $10,000 in this account now.

Now remember, paperMoney is just a simulation and it will vary in many respects to trading in your live account. Specifically, for options traders, remember, as the bid-ask spread widens, your paperMoney platform will probably give you a fill somewhere in the middle of the market. So, if you're backtesting or trying to test a potential strategy, remember you're getting more favorable fills in paperMoney, and those numbers should never be relied on as future success of that strategy. So always keep that in mind. Now, also the paperMoney platform will not assign a short option position early, and that's also different from trading in a real account.

If you're looking for more great investor education checkout Insights & Education on schwab.com, and don't forget check out all of our great content on our YouTube channel.

On-screen text: [Schwab logo] Own your tomorrow®

Frequently Asked Questions

Please be sure to write down or save your Guest Pass username and password, as we will not be able to provide them to you if misplaced. If that happens, you'll need to create a new Guest Pass account using a different email address. 

After your 30-day Guest Pass trial period ends, your credentials will expire and can no longer be used. A Guest Pass can't be extended; however, you can get unlimited access to thinkorswim trading platforms with a Schwab brokerage account. You can open an account online in minutes, and there are no account minimums and no opening or maintenance fees (standard pricing applies to trades placed through the platforms).

No. A Schwab brokerage account cannot be used to log in to or access a thinkorswim Guest Pass account. After the 30-day trial ends, your Guest Pass credentials expire, and your account data and settings are no longer accessible. But as a Schwab client, you'll have unlimited access to thinkorswim trading platforms and the paperMoney® feature, so you can test and optimize your trading strategies using paperMoney. You will also be able to toggle thinkorswim to "live trading" and put what you've learned into action.

paperMoney is the simulated market environment built into the thinkorswim trading platforms. It's designed to give Schwab clients a risk-free way to practice and refine their trading strategies using thinkorswim tools with virtual buying power utilizing real-time simulated market data. A thinkorswim Guest Pass provides a way to access paperMoney for 30 days—no Schwab brokerage account required. The simulated environment allows you to see what it's like to trade your strategies using thinkorswim.

As a Schwab client, you don't need a thinkorswim Guest Pass. You already have unlimited access to the full suite of thinkorswim trading platforms with paperMoney built in. Log in here to learn how to access the platforms.

Please be sure to write down or save your Guest Pass username and password, as we will not be able to provide them to you if misplaced. If that happens, you'll need to create a new Guest Pass account using a different email address. 

Have questions? We're here to help.