Goal Tracker for Schwab Intelligent Portfolios
Key Points
- Planning and goal setting are critical to helping you reach your financial objectives.
- Schwab Intelligent Portfolios® introduces Goal Tracker to help you project hypothetical performance for your portfolio and monitor whether your goal is "on target" towards achieving a savings or income goal.
- The Goal Tracker uses long-term expected return estimates and simulations to show a better, average, or worse outcome to help you monitor if you're "on target" or diagnose whether you need to consider making adjustments to reach your goal.
Introduction
Schwab Intelligent Portfolios provides you with a convenient way to invest and save for an investment goal. The goal can be to accumulate savings, or to take distributions for an income need.
To reach a goal, a plan and clear, concrete, trackable steps help in almost any area of life. Investing is no exception. We believe that financial planning and goal setting are critically important. A good plan should include a clear goal, an understanding of the risks and benefits, and a look at "what if" scenarios. A careful asset allocation and automatic savings schedule puts the plan into action.
It's one thing to invest. It's another thing to invest with a goal in mind. Whether you are saving for retirement or an upcoming expense, the Goal Tracker helps you monitor your investment goal, which is set up based on your risk profile, investment amount, and your planned monthly contributions. If you are seeking to generate retirement income, the Goal Tracker also allows you to set up your target monthly withdrawal amount and will monitor whether your income stream will last as long as you need it to based on the information that you provide.
After you set up a goal, the Goal Tracker will help project hypothetical portfolio performance and will monitor whether your goal is "on target," "off target," or "at risk" so that you can track your progress over time and make any necessary adjustments. It is as simple as going to the Goal tab of your Schwab Intelligent Portfolios dashboard and with a few clicks, you can see how to get back on track.
Goal Tracker can help you anticipate how your account could perform, within a range of hypothetical outcomes, to help you work towards your goal. The rest of this whitepaper describes how Goal Tracker projects hypothetical portfolio performance and tracks your account in relation to your goal.
What is Goal Tracker?
Goal Tracker is a tab in your Schwab Intelligent Portfolios dashboard that helps you set up and track an investment goal for an account. It projects how your portfolio might perform using a range of outcomes to help you see how close you are to reaching your future goal.
Keep in mind, the hypothetical illustrations provide projections, not guarantees, but they can help you consider how your portfolio could perform, if things go as projected over time.
Goal Tracker saves your goal and monitors daily whether your portfolio is "on target," "at risk," or "off target." These graphics are dynamic, and you can make adjustments to variables, such as your contributions, and see how those changes impact your potential to reach your goal.
Goal Tracker methodology
One relatively straight-forward way to project performance of a portfolio is to estimate an average annual or monthly return for your portfolio, and then use that to calculate your returns, every month, for the rest of your stated investment horizon. This method is called straight-line appreciation.
However, returns are almost never average. Markets are inherently unpredictable and volatile, so we can't assume an average return every month or even every year. Instead, the Goal Tracker uses Monte Carlo simulation to provide probability analysis on the likelihood that your assets will reach your savings goal or that your income will last until a selected end date.
What is Monte Carlo simulation?
Goal Tracker uses a statistical simulation technique, used widely in finance, engineering and other fields, to simulate a range of paths for portfolio performance, based on long-term return estimates and annual volatility around those estimates.
For example, a hypothetical portfolio might be estimated to deliver an average 6% annual return per year over time. However, in any single year, it might deliver -10%, 15%, -3%, 8% or a wide range of other possible paths to get there. Each path may be different.
It'd be great if we could assume that a portfolio would receive the average estimated return every month, and every year, like clockwork. Unfortunately that's not the way markets work. In some months and years, market returns are up, and in some months and years, they are down. Over time, however, we anticipate that they'll be positive over time, if you have a long enough time horizon.
Not every portfolio will end up generating the average estimated annual return over the planning time horizon. Some portfolios may experience a "better" than average series of returns, and some portfolios may receive a "worse" than average series of returns. As noted above, this is part of the inherent uncertainty of investing.
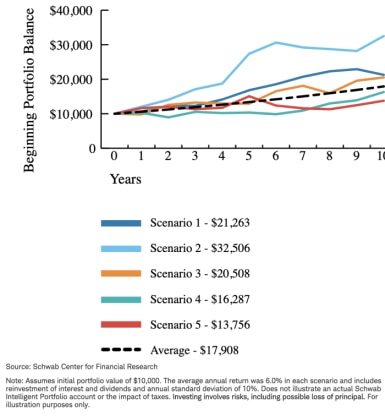
Monte Carlo simulation is a bit like writing down on slips of paper various ranges of projected returns that we think you could receive in a month and putting them into a hat. For each month of your goal, we'd pull out one piece of paper and use that as the projected return for that month, based on a range of projected returns. We do this for every month until the end of your stated time horizon to calculate a hypothetical or projected ending balance. We repeat this series of draws 999 times, to give us a range of possible outcomes. This helps us simulate the uncertainty of markets and ranges of performance.
The exhibit below shows five such trials. Goal Tracker runs many more and then summarizes them in a simpler chart to stress test the likelihood of meeting your goal.
Exhibit 1: Monte Carlo simulates multiple scenarios
Long-term return estimates
To create the simulations described above, Goal Tracker uses long-term return estimates provided by Charles Schwab Investment Management Inc. (CSIM) to estimate the performance of your portfolio. In other words, Goal Tracker doesn't just choose a random range of numbers to guess on how your portfolio might perform. It bases the simulated returns on long-term return estimates, within a range of possible paths, to show projected performance.
To create these long-term return estimates, CSIM uses a set of factors including interest rates, earnings, dividends and others to estimate future returns and risk on a wide range of asset classes including equities, bonds, and commodities, etc. The long-term return estimates will vary based on your portfolio.
Keep in mind, these are estimates, and actual performance will vary and may be less predictable over short time horizons. The performance projections assume monthly rebalancing and reinvestment of interest and dividends. They do not include inflation, fees or taxes.
The performance and volatility of your portfolio and the ending balance will almost certainly vary, each year, and over time. Past performance or projections are not guarantees of future performance, but we believe that we can give you a range based on how we think the future will unfold.
Better, average, worse, and very poor market
Since no one knows how markets or portfolios will perform in the future with certainty, it helps to project a range of possible outcomes, using our best estimates of how your portfolio might perform over time.
Goal Tracker uses the simulations to chart a range of possible performance, from a "better," "average," "worse," and "very poor" market. This will help you track your goal over time and the range of possible outcomes. The ranges are described below.
- The "better" market shows your projected ending balance in the 75th percentile best outcome, based on the many simulations of your portfolio's performance from the Monte Carlo simulation. In other words, the 750th best out of 1,000 ending balances. You would only beat this in 25% of the simulations.
- The "average" market shows the ending balance in the 50th percentile best outcome in the simulations. In other words, the 500th best out of 1,000 ending results. This is the median outcome in the 50th percentile (or median) simulation.
- The "worse" market shows the ending balance in the 25th percentile best outcome. In other words, the 250th best of 1,000 ending results. You would achieve this in 75% of the simulations.
- The "very poor" market shows the ending balance in the 10th percentile best outcome. In other words, the 100th best of 1,000 ending results. You would achieve this in 90% of the simulations.
Table 1
Exhibit 2: "Better," "average," "worse," and "very poor" markets
- Market performance
- Your projected ending balance would reach this amount...
-
Market performanceBetter marketYour projected ending balance would reach this amount...In 25% of the simulations
-
Market performanceAverage marketYour projected ending balance would reach this amount...In 50% of the simulations
-
Market performanceWorse marketYour projected ending balance would reach this amount...In 75% of the simulations
-
Market performanceVery Poor marketYour projected ending balance would reach this amount...In 90% of the simulations
Note: The 50th percentile simulation is the median outcome (you succeed in achieving your goal 50% of the time), the 100th percentile simulation is the very best outcome, and the 1st percentile simulation is the very worst outcome.
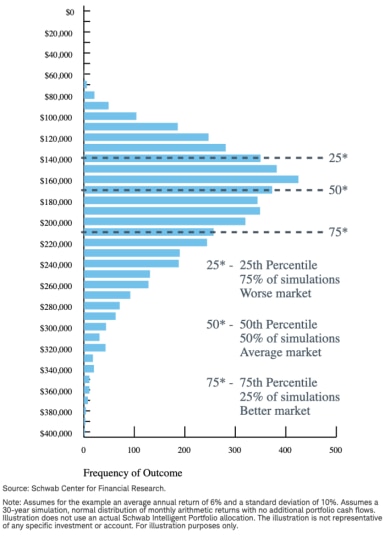
For example, take a look at the exhibit below. It shows a sample range of ending balances—a "distribution" of all of the trials—simulated. In this example, Goal Tracker assumes you start with $100,000, don't make additional contributions to your account, and save for 10 years.
Based on the return assumptions described in the note – which are for illustration only, not your portfolio—Goal Tracker projects that you'll end up with an ending balance of at least $140,000 in a "worse market" (i.e., 75% of the trials), at least $172,000 in an "average" market (i.e., 50% of the trials), and at least $212,000 in a "better" market (i.e., 25% of the trials).
Exhibit 3: Sample ending balance distributions
"On Target" and "At Risk" and "Off Target"
Using these projections described for your portfolio, Goal Tracker utilizes the range of projected outcomes to track whether your goal is "on target," "at risk," or "off target," based on the "better," "average," "worse," or "very poor" markets. In other words, what sort of market or portfolio performance do you need to experience for your goal to succeed?
There are differences in the tracking indicators for the savings and income goals, and whether Goal Tracker considers your goal "on target," "at risk," or "off target," based on ranges set in Goal Tracker and described below.
Understanding the savings goal illustrations
In Goal Tracker, you can choose two goal types: a savings goal – where you are saving for a future objective – and an income goal—where you are taking distributions from your portfolio now. A retirement or education goal, for example, are savings goals.
You "succeed" in a savings goal when you successfully save, invest, and build an ending balance that exceeds your goal. As you save and invest on the way toward your goal, your goal can be "on target," "at risk," or "off target." Knowing where you stand will help you make adjustments, if necessary, to reach your goal.
The table below shows how Goal Tracker defines whether your savings goal is "on target," "at risk," or "off target."
Table 2
Exhibit 4: Goal status for savings goal
Exhibit: Goal Status for Savings Goal- Goal Status
- Definition
-
Goal Status"On Target"DefinitionBetter than 50% chance of reaching your goal
-
Goal Status"At Risk"DefinitionBetween a 25% and 50% chance of reaching your goal
-
Goal Status"Off Target"DefinitionLess than a 25% chance of reaching your goal
Exhibit 5: Savings goal "On Target"
The illustration below shows a savings goal that is "on target." The savings goal is considered to be "on target" if you have a 50% chance or better of reaching your goal based on the projections, assuming that you continue to make the contributions according to your plan and other assumptions remain the same. In the example below, the goal is to accumulate $680,000 over 30 years, and the illustration shows that Goal Tracker projects a 50% probability that the portfolio will grow to over $684,251, based on current assumptions. The goal is "on target."
For illustrative purposes only.
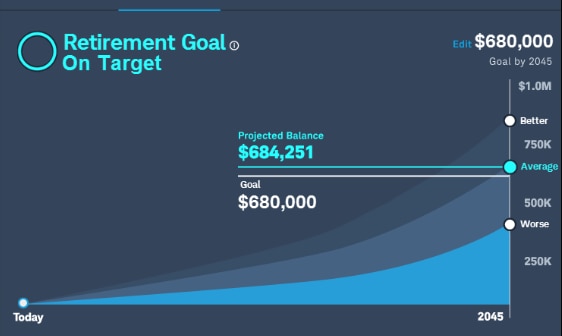
Exhibit 6: Savings goal "At Risk"
Your savings goal is shown as "at risk" if it can only be achieved between an "average market" performance and a "better market." You need the portfolio to perform a bit better than average to reach your goal. In the example below, the goal over 30 years is to accumulate $680,000. However, we only project with a 50% probability a balance of just about $560,000. The goal is "at risk."
For illustrative purposes only.
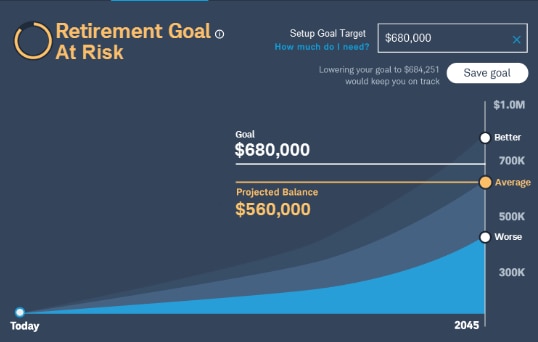
Exhibit 7: Savings goal "Off Target"
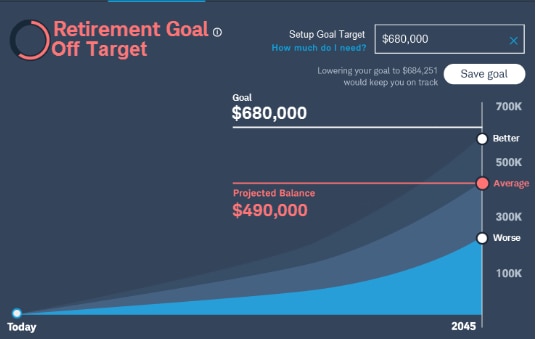
Your savings goal is "off target" if your desired ending balance is achieved only if you experience a "better market" or better. We don't believe that you should anticipate or rely on a market performing well above average to achieve your goal. You should increase your contributions or change your goal. In this example, the goal is ambitious - $680,000—relative to the projected balance - $490,000— in an average market. Goal Tracker projects that the likelihood that you will achieve your goal is less than 25%, so you are "off target."
For illustrative purposes only.
Understanding the income goal illustrations
In addition to a savings goal, you can also choose an income goal, if you have reached your savings objective and are using your portfolio to generate income and draw down the account balance over time.
In the income goal, we assume that your objective is to not draw your account down to $0 before the end date of your goal. Goal Tracker has a higher threshold for "on target" in the income goal because the stakes are likely higher if your account runs out of money than it is if you miss a savings goal. If you choose an income goal, Goal Tracker shows different illustrations and break points.
The table below shows how Goal Tracker defines whether your income goal is "on target," "at risk," or "off target."
Table 3
Exhibit 8: Goal status for an income goal
Exhibit: Goal Status for an Income Goal- Goal Status
- Definition
-
Goal Status"On Target"DefinitionBetween a 90% and 75% chance of your money lasting
-
Goal Status"At Risk"DefinitionLess than a 75% chance but better than a 50% chance or your money lasting
-
Goal Status"Off Target"DefinitionLess than a 50% chance of your money lasting
Exhibit 9: Income goal "On Target"
Your income goal is "on target" if you have money left over on your end date in the "worse" market or better scenario (i.e., success between 90% and 75% of the time). We believe that you should be able to sustain spending with between 90% and 75% confidence. The illustration below shows an income goal that needs to last 30 years. There's a positive ending balance between the 10% "very poor" and 25% "worse" outcome.
In the illustration above, the 2045 date shows the projected final withdrawal date in a "very poor" market. Goal Tracker projects that your money will run out in only 10% of the simulations. The 2070 date shows the projected final withdrawal date in a "worse" market. Goal Tracker projects that your money will run out in only 25% of the simulations. The third dot shows that your money will last past your projected final withdrawal date in the "average" market, or will run out in 50% of the simulations.
For illustrative purposes only. Not representative of any specific investment or account.
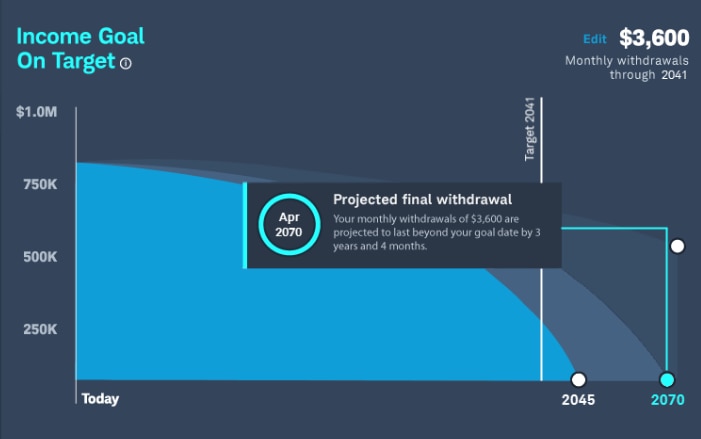
Exhibit 10: Income goal "At Risk"
Your income goal is "at risk" if you have money left over only between the "worse" and "average" market (i.e., success between 75% and 50% of the time). You may want to change your distributions if you'll only have money left in the "average" market or better. In the case below, the money runs out in the "poor" market, or 25% of the time.
For illustrative purposes only. Not representative of any specific investment or account.
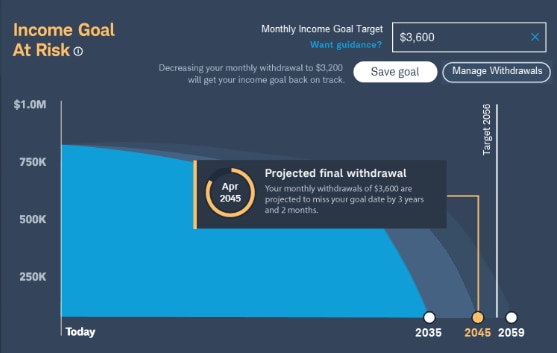
Exhibit 11: Income goal "Off Target"
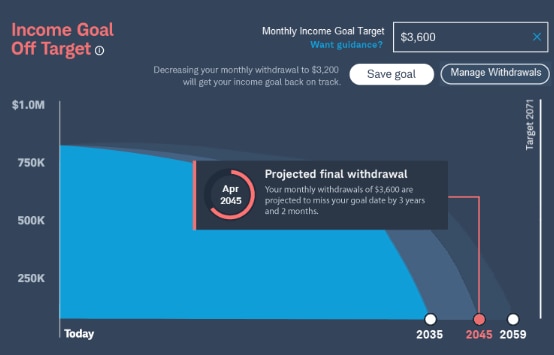
Your income goal is "off target" if you have money left over only in the "average" market or better (i.e., success less than 50% of the time). The chance of having money left is a 50/50 coin flip or worse. The example below shows that you need a market better than what's projected on average to have money left over at your end date.
For illustrative purposes only. Not representative of any specific investment or account.
Getting back "On Target"
Now that you know where you stand with your goal, how do you get back "on target?" The tables and narrative below suggest actions you can consider to get your savings or income goal back "on target."
You can extend—or shorten—your time horizon, decrease your goal amount, increase (decrease) monthly contributions (distributions), or make a one-time contribution.
Table 4
Exhibit 12: Goal status for savings goal
Exhibit: Goal Status for Savings Goal- Goal Status
- Suggested Action
-
Goal Status"On Target"Suggested ActionLooking good. Continue to monitor your progress
-
Goal Status"At Risk"Suggested ActionYour goal has gone off target based on our projections. Consider adjusting your contribution amount based on your current situation
-
Goal Status"Off Target"Suggested ActionYour goal has gone off target based on our projections. Consider adjusting your contribution amount based on your current situation
Table 5
Exhibit 13: Goal status for an income goal
Exhibit: Goal Status for an Income Goal- Goal Status
- Suggested Action
-
Goal Status"On Target"Suggested ActionLooking good. Continue to monitor your progress
-
Goal Status"At Risk"Suggested ActionYour income goal is at risk. Consider lowering your monthly withdrawal amount
-
Goal Status"Off Target"Suggested ActionYour income goal has gone off target. Lower your monthly withdrawal amount.
Don't overreact to a down market
If your goal is "off target" due to a dip in the market, don't think first of upping the risk in your portfolio. Your risk tolerance is your risk tolerance and doesn't change, generally, based just on a change in your goal's status or changes in the market.
Down markets are a part of investing, and may occasionally put your goal "off track." Goal Tracker projects a hypothetical range of outcomes so when markets dip and your emotions start to get the best of you, you can come back to the Goals tab and see if you are still "off track" and by how much. This can give you a little better perspective during the ups and downs in all investment markets over time.
If your time horizon shortens, or life conditions change, you may want to reevaluate your allocation or your goal.
Conclusion
Setting goals and tracking progress toward those goals is an important part of success in investing. If you set a goal, it increases the likelihood of success. Goal Tracker helps project possible hypothetical outcomes, stress test your plans, and keep you on track towards your financial objectives.
